Market Momentum: Your Weekly Financial Forecast & Market Prep
Issue 72 / What to expect Dec 08, 2025 thru Dec 12, 2025

In This Issue
Weekly Market-On-Close Report: All the macro moves, market drivers, and must-know narratives—covered in less than five minutes.
Weekly Benchmark Breakdown: Our weekly intelligence report on major indices cuts through the index-level noise to uncover participation, momentum, and structural integrity and tell you whether markets are rising on solid ground or skating on thin breadth. This is where bull markets prove themselves—or quietly start to unravel.
The Latest Investor Sentiment Readings: Track the emotional pulse of the market with our curated dashboard of sentiment indicators. From fear-fueled flight to euphoric overreach, this week's readings reveal whether investors are cautiously creeping in—or stampeding toward the exits.
Institutional Support & Resistance Levels For Major Indices: Exactly where to look for support and resistance this coming week in SPY, QQQ, IWM & DIA
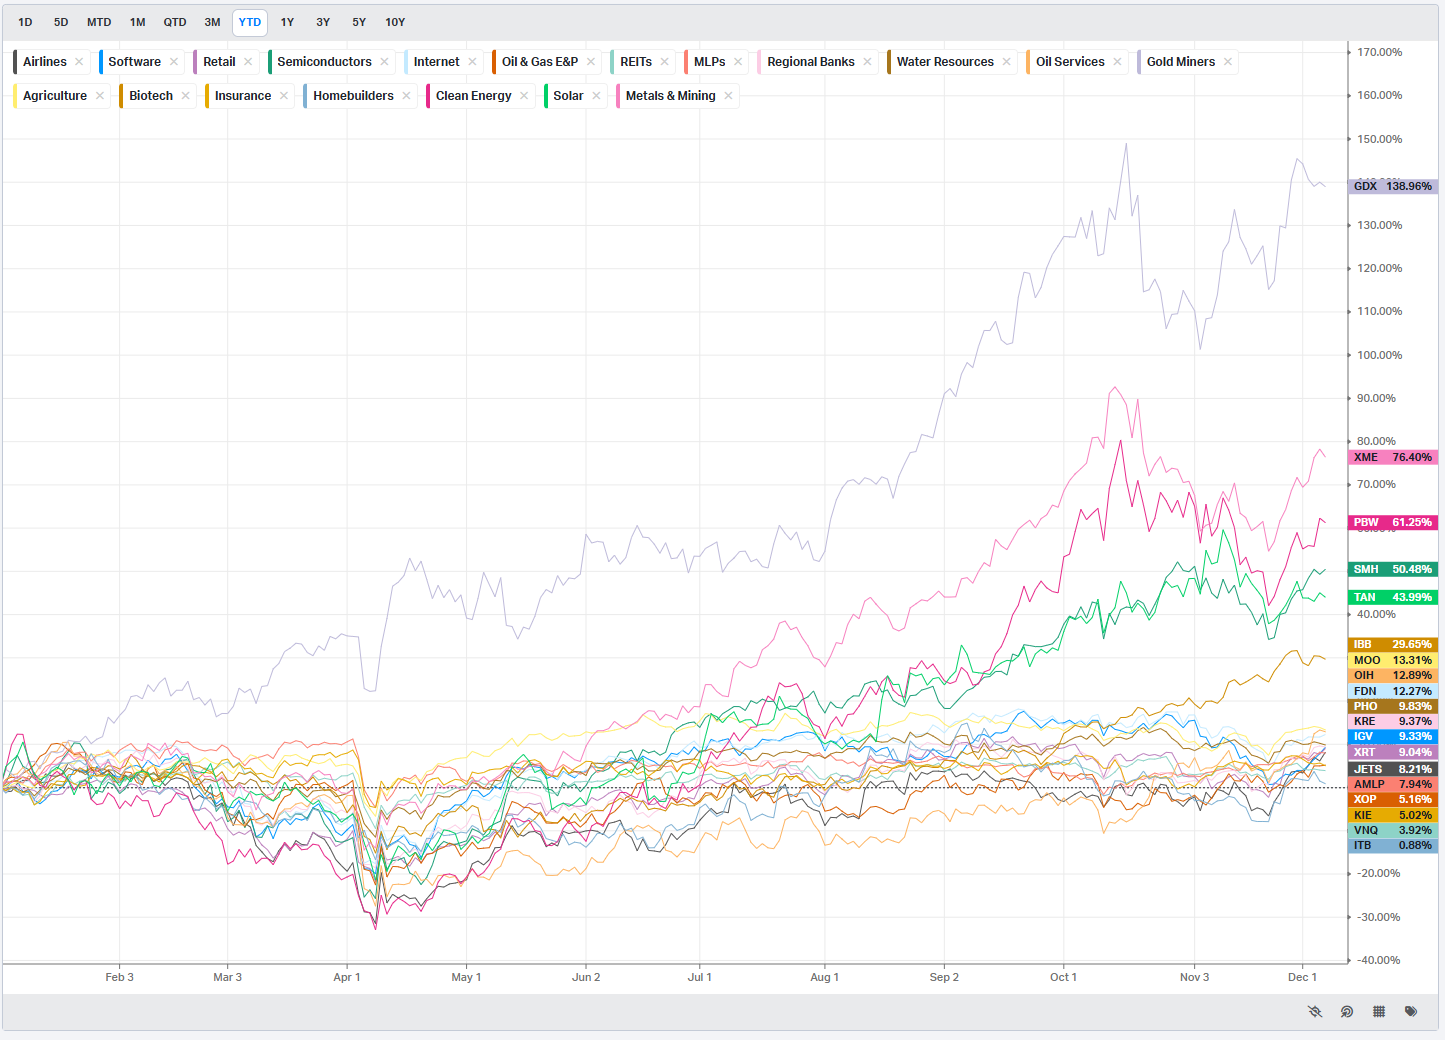
Normalized Performance By Thematics YTD: Which corners of the markets are beating benchmarks, which are overlooked and which ones are over-crowded!
Key Econ Events & Earnings On-Deck For This Coming Week
Market Intelligence Report: Track the real money. This section breaks down where institutions are placing their bets—and pulling their chips. You'll get a sector-by-sector view of flows, highlighting the most active names attracting large-scale buying or selling. We go beyond the headlines and into the tape, surfacing the week’s most notable block trades and sweep orders, both on lit exchanges and hidden dark pools. Whether you're following momentum or fading crowded trades, this is your map to where size is moving and why it matters.

Weekly Market-On-Close Report
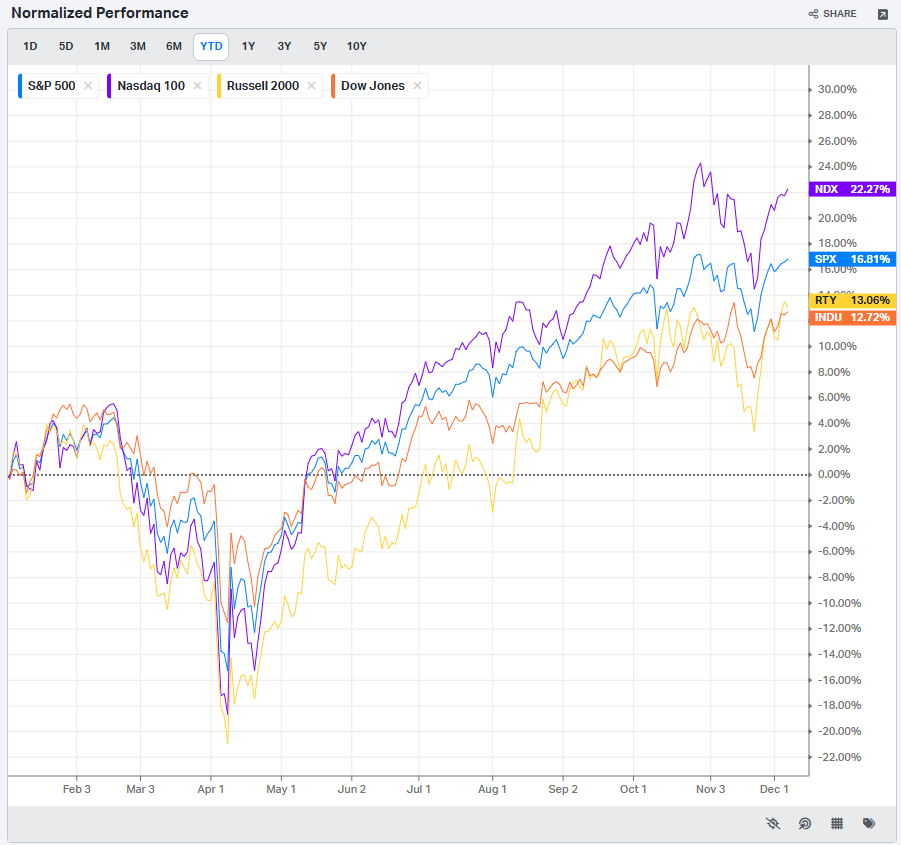
Stock indexes came into December with the wind at their backs. By Friday’s close, the S&P 500 had climbed to a 5-week high, the Nasdaq 100 marked a 1-month high, and the Dow Jones Industrial Average pushed to a 3-week high. The broader Nasdaq Composite advanced 0.91% on the week, the small-cap Russell 2000 gained 0.84%, and the S&P 500 added a modest but meaningful gain of its own. Both the cap-weighted and equal-weight S&P 500 finished the week slightly higher, and Friday’s advance made it eight wins in the last nine sessions for the S&P 500.
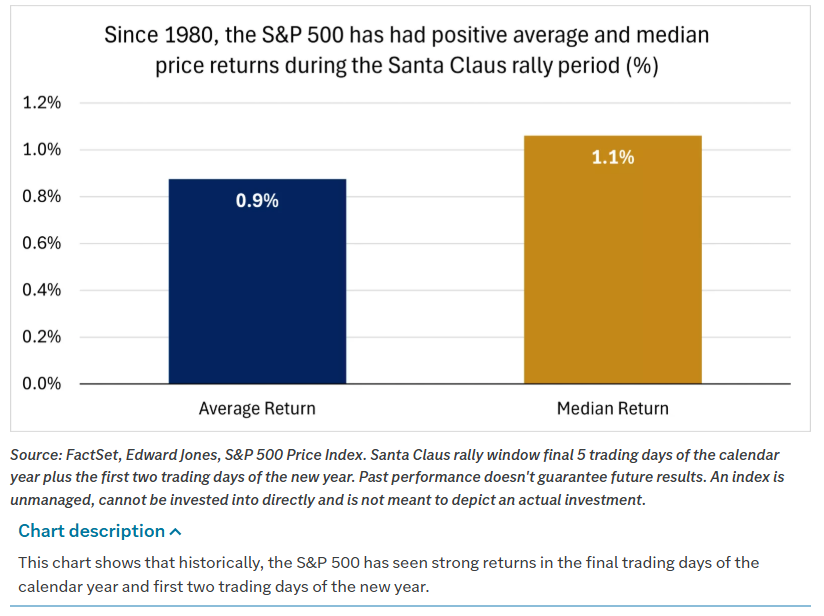
Under the surface, the story was about more than simple price appreciation. Optimism about the economic outlook, falling inflation expectations, and the prospect of another Federal Reserve rate cut next week underpinned the move. Market seasonals remain supportive as well. December is historically a favorable month, and investors are already debating whether we will get a Santa Claus rally during the final five trading days of the year and the first two of January, a period that has been positive roughly 73% of the time since 1980 with an average S&P 500 gain of about 1.1%.
The broader context matters. In the very holiday-shortened Thanksgiving week, the S&P 500 finished up roughly 4% as the 100-day moving average held as support. That bounce allowed the index to regain its footing, reclaim the 50-day moving average, and push back above the 6800 level. Mid and small caps outperformed during that stretch, adding 4–6%, and crypto bounced after a rough sell-off. This week, sandwiched between that powerful short week and next week’s Fed meeting, has been about digestion. Since reclaiming 6800 on the day before Thanksgiving, the S&P 500 has drifted a little higher, trading in a relatively tight 6800–6900 band, within 1% of its all-time high.
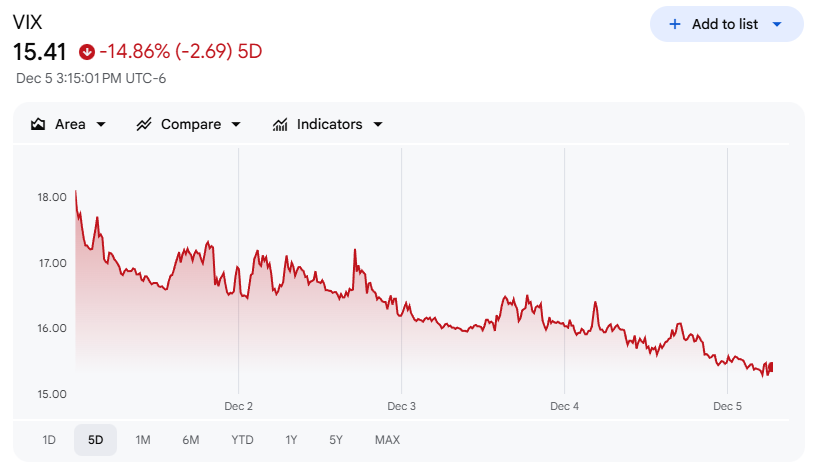
Volatility has compressed alongside the grind higher. The VIX has declined from around 26 on November 20 to below 16 now, which is a very mild level given the macro calendar ahead. That combination of steady price gains and falling volatility is exactly what you expect to see as markets price in a relatively benign path for rates and growth into year-end.
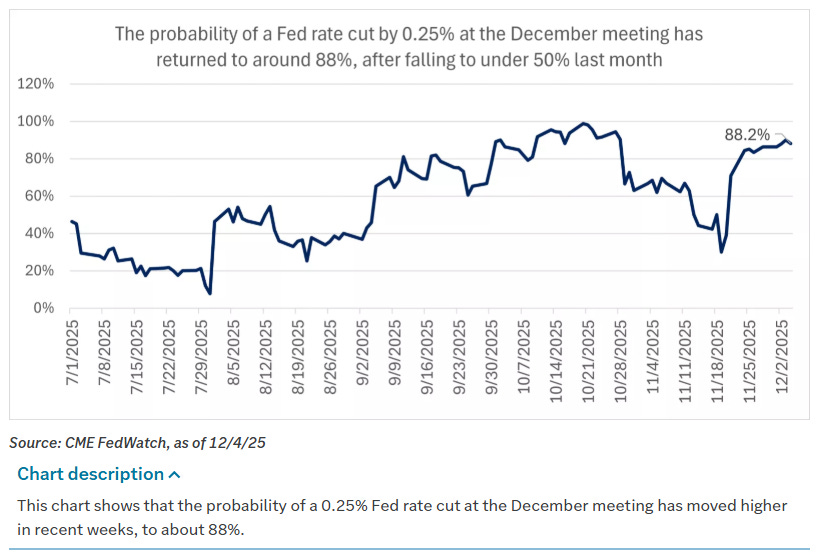
Market structure was influenced as much by the calendar as by fundamentals. Last week’s Thanksgiving holiday left trading volumes light and liquidity pockets shallow. Investors are now focused squarely on the Federal Reserve’s final meeting of the year on December 9–10, with markets discounting roughly a 95% probability of a 25 basis point rate cut and some probability gauges closer to the high-80s percent range.
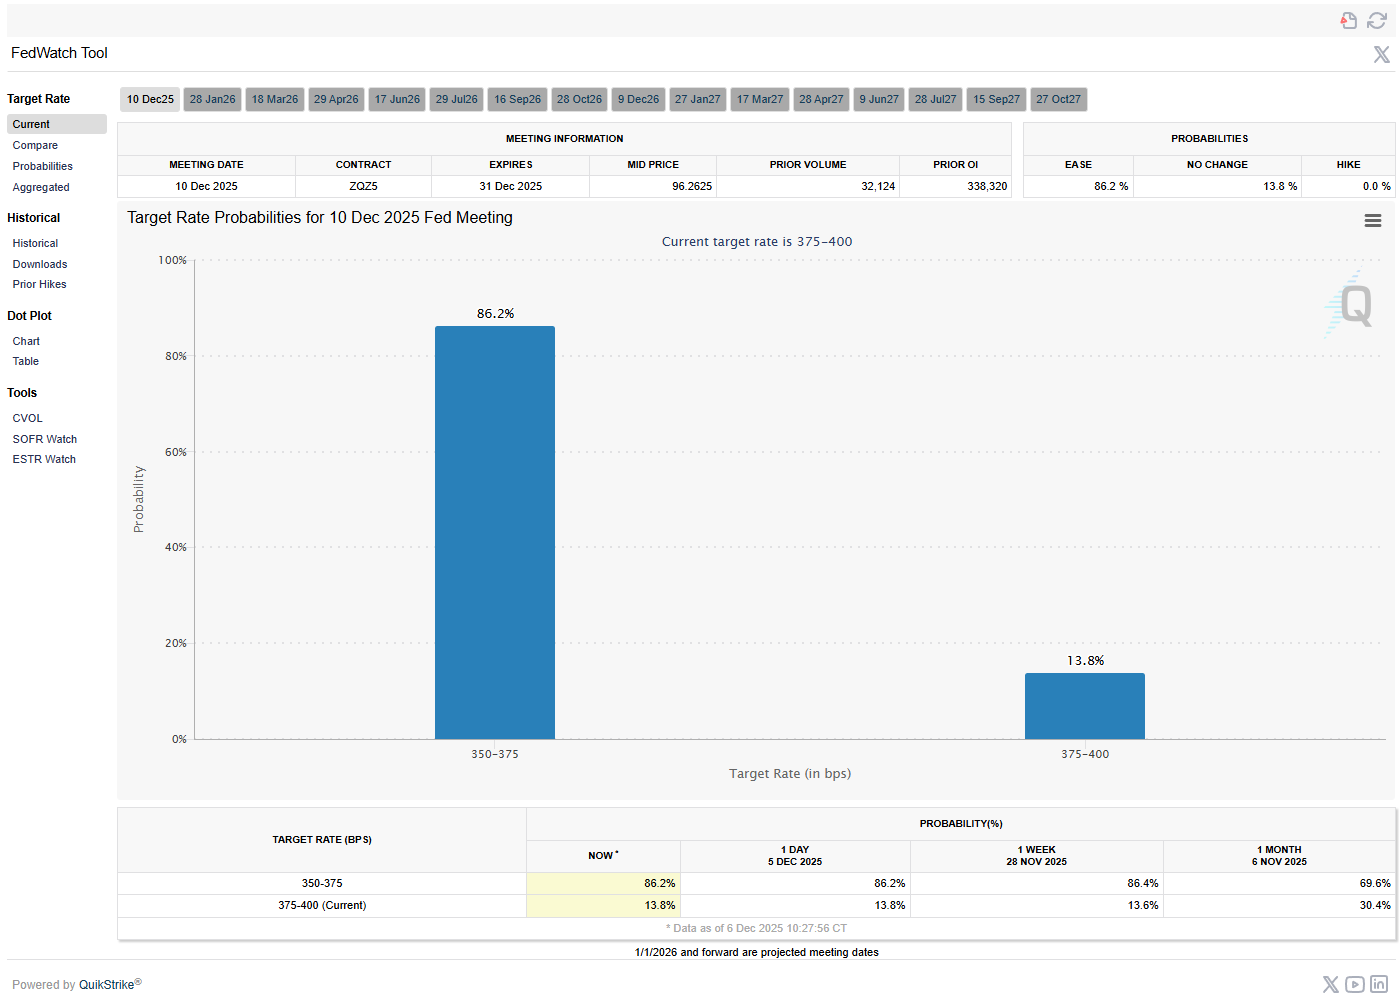
The meeting will not just deliver a rate decision. It will also bring an updated Summary of Economic Projections and the dot plot, which will give the market a clean look at where policymakers expect the fed funds rate to settle over the next several years. The working assumption embedded in current pricing is that the Fed is on a path to move the policy rate toward a more neutral range around 3.0%–3.5% over the coming year. Importantly, the narrative is that the Fed is cutting not because a recession is imminent, but because the policy stance has been restrictive for some time and the near-term outlook has softened at the margin.
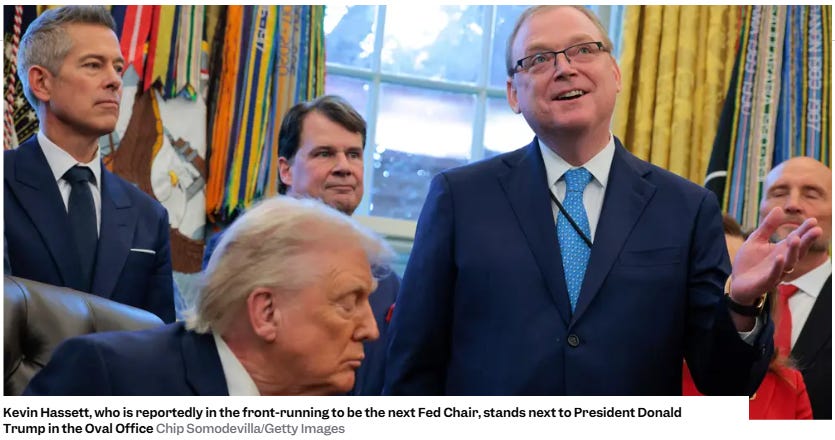
The political backdrop is not entirely in the background either. President Trump said this week that he will announce his selection for the next Fed Chair in early 2026. Reporting has suggested that National Economic Council Director Kevin Hassett is viewed as the likely choice to succeed Jerome Powell. Hassett has publicly supported President Trump’s approach to cutting interest rates, which would raise fresh questions about the Fed’s independence if he were nominated and confirmed. A separate Supreme Court decision on tariffs is also expected at some point, more likely closer to year-end, with the potential to reshape trade expectations heading into 2026.
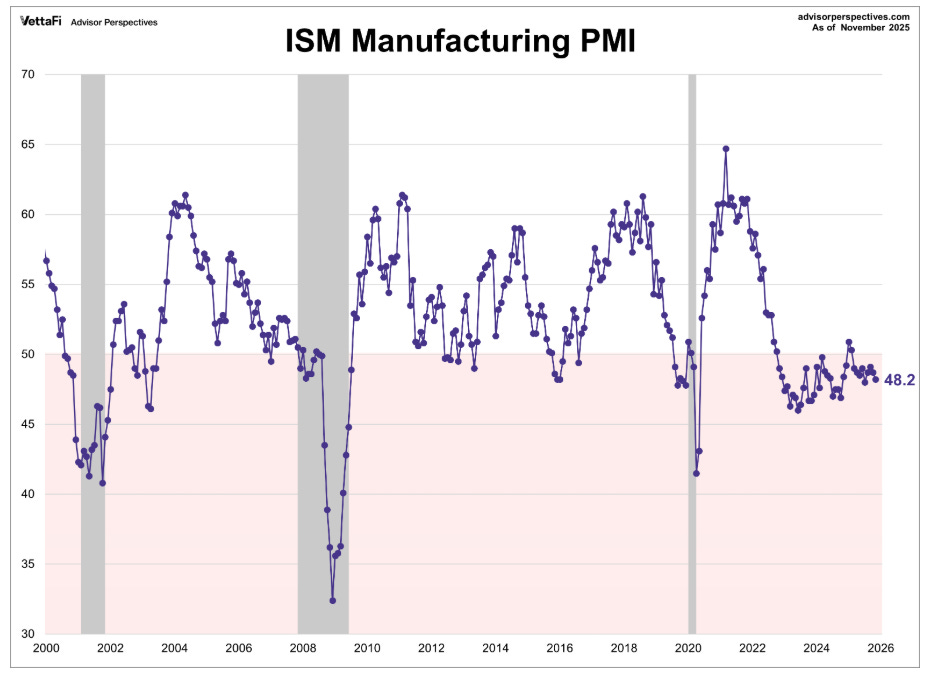
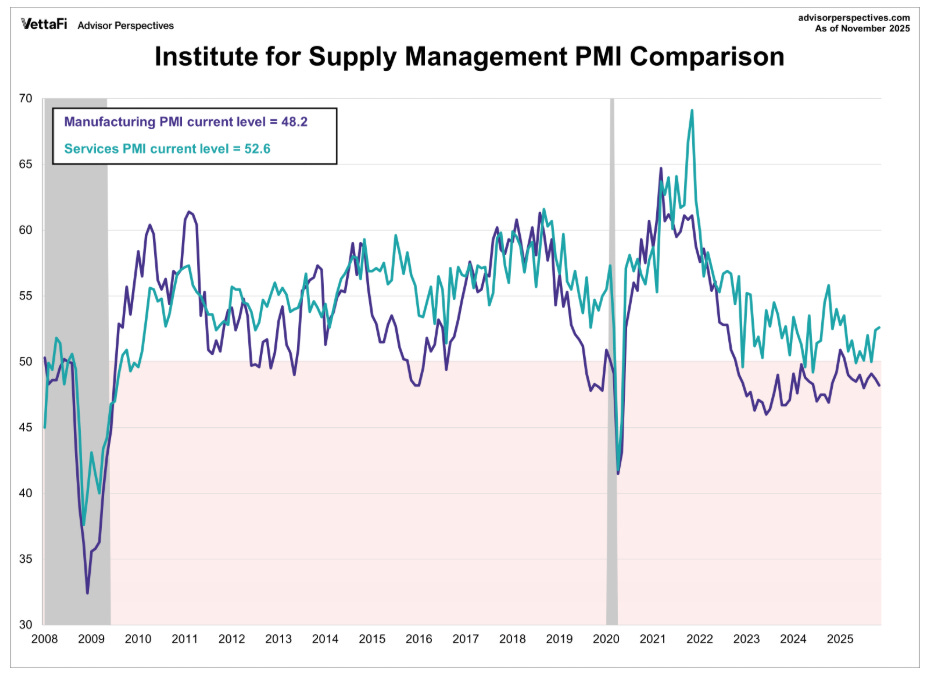
On the macro front, data painted a familiar picture of a two-speed economy. Manufacturing remains in contraction while services continue to expand, and the resilience of the consumer looks increasingly K-shaped across income and firm size.
The Institute for Supply Management’s Manufacturing PMI slipped to 48.2 in November from 48.7 in October, marking a ninth consecutive month in contractionary territory. Readings below 50 indicate contraction, and this decline was driven by pullbacks in supplier deliveries, new orders, and employment. Input prices rose for the 14th consecutive month and at a faster rate than in October, reminding investors that goods inflation is not entirely dead even as headline readings improve.
By contrast, ISM Services told a more constructive story. The services PMI rose by 0.2 percentage points to 52.6 in November, the fastest pace since February. Under the hood, new orders fell from 56.2 to 52.9, employment improved slightly but stayed in contractionary territory, and the prices index dropped sharply from 70.0 to 65.4. That prices reading is the lowest since April and sits just below the 12-month average of 66.1, suggesting that price pressures in the services sector, while still elevated, are easing modestly.
The Logistics Managers Index added another nuance. The LMI showed similar dynamics to prior months, but for the first time in the series’ nine-year history respondents reported using less available warehousing space month over month, driven by continued drawdowns in inventory stocks. That fits with a narrative of cautious restocking and careful working capital management late in the cycle.
On the consumer side, you can see the K-shaped dynamic clearly. Mastercard’s SpendingPulse data showed Black Friday sales rising 4.1% year over year, with e-commerce up 10.4% and in-store spending up 1.7%. Other data providers pegged Cyber Monday growth at roughly 7.1% year over year. Retailers were among the better-performing stocks this week on the back of positive reactions to earnings and conference commentary, particularly for value-focused chains. At the same time, the strength of discount and value-oriented retailers can be read as a sign that lower- and middle-income consumers are trading down and stretching dollars in response to lingering price pressures.
Labor data reinforced the notion of a slowing but not collapsing jobs market, with a pronounced divergence between small businesses and large companies.
On Wednesday, ADP reported that private sector payrolls decreased by 32,000 in November, a sharp reversal from October’s revised gain of 47,000 and the largest monthly drop since March 2023. The entire decline was driven by small businesses, which shed 120,000 jobs, while medium- and large-sized firms added to headcount. Hiring at the largest companies has remained positive for six straight months, averaging just under 50,000 jobs per month. It is another clean example of the K-shaped economy: smaller firms feel the pinch of tighter credit and softer demand more quickly, while large firms with stronger balance sheets and access to capital markets continue to add selectively.
Challenger, Gray & Christmas reported that U.S. employers announced more than 71,000 job cuts in November, the most for the month since 2022. That still represented a sharp decline from the prior month’s 153,000 announced cuts and brought the year-to-date total to around 1.17 million, the highest level since 2020. In other words, the pace of layoffs remains elevated versus pre-pandemic norms but has decelerated in recent months.
Meanwhile, the Labor Department reported that initial claims for unemployment benefits for the week ended November 29 fell unexpectedly to 191,000, a decrease of 27,000 from the prior week’s revised level and the lowest reading since September 2022. It was also the first sub-200,000 print since January 2024. Claims are one of the cleaner, high-frequency gauges of labor stress, and levels near 191,000 simply do not align with a labor market on the edge of a severe downturn.
Looking ahead, the November nonfarm payrolls report on December 16 will be the first complete jobs report since the October government shutdown. Consensus forecasts call for total job gains of 38,000 in November, well below the 119,000 recorded in September. The unemployment rate is expected to edge higher from 4.4% to 4.5%, while wage growth is projected to slow from 3.8% year over year to 3.6%. That still implies wage growth running ahead of the roughly 2.8% inflation rate, which is supportive of real household income even as nominal momentum fades.
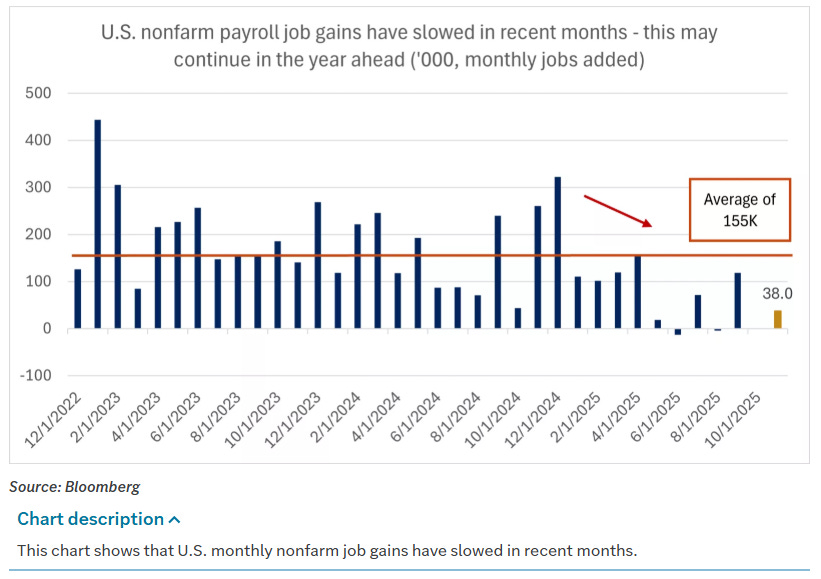
Taken together, demand for labor has cooled, with job openings drifting lower and private payrolls printing a negative month, while the supply side remains constrained by demographics, stagnant participation, and a complex immigration backdrop. The net result is a labor market that is softer but still far from weak, and one where investors will likely have to get used to monthly payroll gains that look more like 38,000 than 300,000 as the new normal.
Inflation data continued to give the Fed cover to ease off the brakes. The Bureau of Economic Analysis reported that the personal consumption expenditures (PCE) price index rose 0.3% month over month in September, matching August’s reading. Core PCE, which strips out food and energy, rose either 0.2% or 0.3% month over month depending on the breakdown you focus on, with the year-over-year change in the core index running at 2.8%. The original release of September data was delayed by the government shutdown that began in October, and the BEA has not yet announced a rescheduled release date for October’s numbers. That means policymakers and investors are still flying with a slightly stale altimeter, but the broad picture is of inflation settling in the 2.5%–3.0% range.
Survey-based measures tell a similar story. The University of Michigan’s preliminary December Index of Consumer Sentiment improved by 2.3 points from November to 53.3, beating expectations of 52.0. The gain was driven mostly by better expectations for personal finances, even though respondents continued to describe their overall views as broadly somber due to the ongoing burden of high prices.
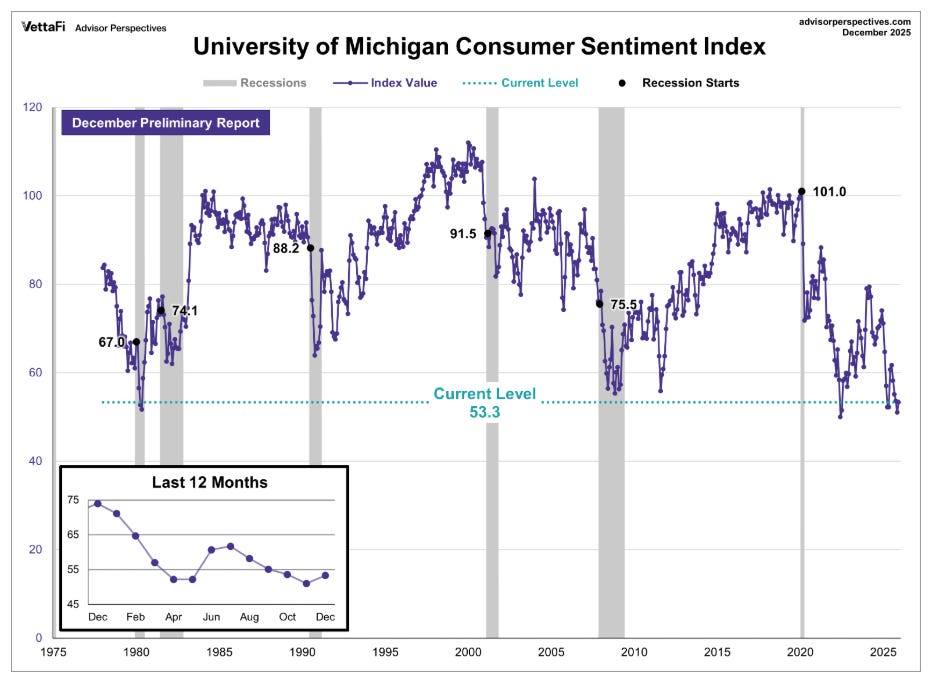
More important for the Fed, inflation expectations eased. One-year inflation expectations fell from 4.5% to 4.1%, which was better than the consensus for no change and marked the lowest reading since January 2025 as well as the smallest pace of increase in 11 months. Five- to ten-year expectations declined from 3.4% to 3.2%, again the smallest 11-month increase and better than expectations for stability. Market-based measures moved in the same direction earlier in the week, with the 10-year breakeven inflation rate ticking up to a 2-week high of 2.284% before stabilizing.
For the Fed, the combination of core PCE running at 2.8% year over year and survey-based expectations drifting lower is almost ideal. It suggests that restrictive policy has done its job without forcing the economy into a deep slowdown. With growth likely to soften in the fourth quarter as the effects of the shutdown show up in the data, and with labor indicators cooling but not collapsing, it would be surprising if the Fed chose to risk the labor market falling substantially further from here by keeping policy as tight as it has been.
Despite favorable inflation news, Treasuries underperformed this week as long-term yields moved higher. March 10-year T-note futures (ZNH6) closed down 6.5 ticks on Friday, with the 10-year yield rising 4.1 basis points to 4.139% and touching a 2-week high of 4.143%. Gains in equities curbed safe-haven demand for Treasuries, and rising global yields added pressure.
On the international side, Japanese 10-year JGB prices fell to an 18-year low amid expectations that the Bank of Japan could hike rates later this month. That move helped pull global yields higher and contributed to a bear steepening in the U.S. Treasury curve, with the long end rising on the order of 10 basis points over the week. In Europe, the 10-year German bund yield matched an 8-month high at 2.801% intraday and finished up 2.8 basis points at 2.798%, while the 10-year UK gilt yield rose 4.2 basis points to 4.476%. Eurozone third-quarter GDP was revised slightly higher to 0.3% quarter over quarter and 1.4% year over year from an earlier 0.2% / 1.4% print, and German October factory orders surprised to the upside at 1.5% month over month versus expectations for 0.3%. Even so, swaps are pricing only about a 1% chance of a 25 basis point rate cut by the ECB at its December 18 meeting.
In the U.S., Treasuries generated negative returns across most maturities, although some short-term yields dipped slightly. Municipal bonds also posted losses but outperformed Treasuries as demand remained steady despite a healthy calendar of new issuance. High yield bonds, by contrast, recorded gains, supported by a firmer macro backdrop and a return to more normal liquidity conditions after Thanksgiving. Credit markets, in other words, are still signaling that the growth backdrop is slowing but not breaking.
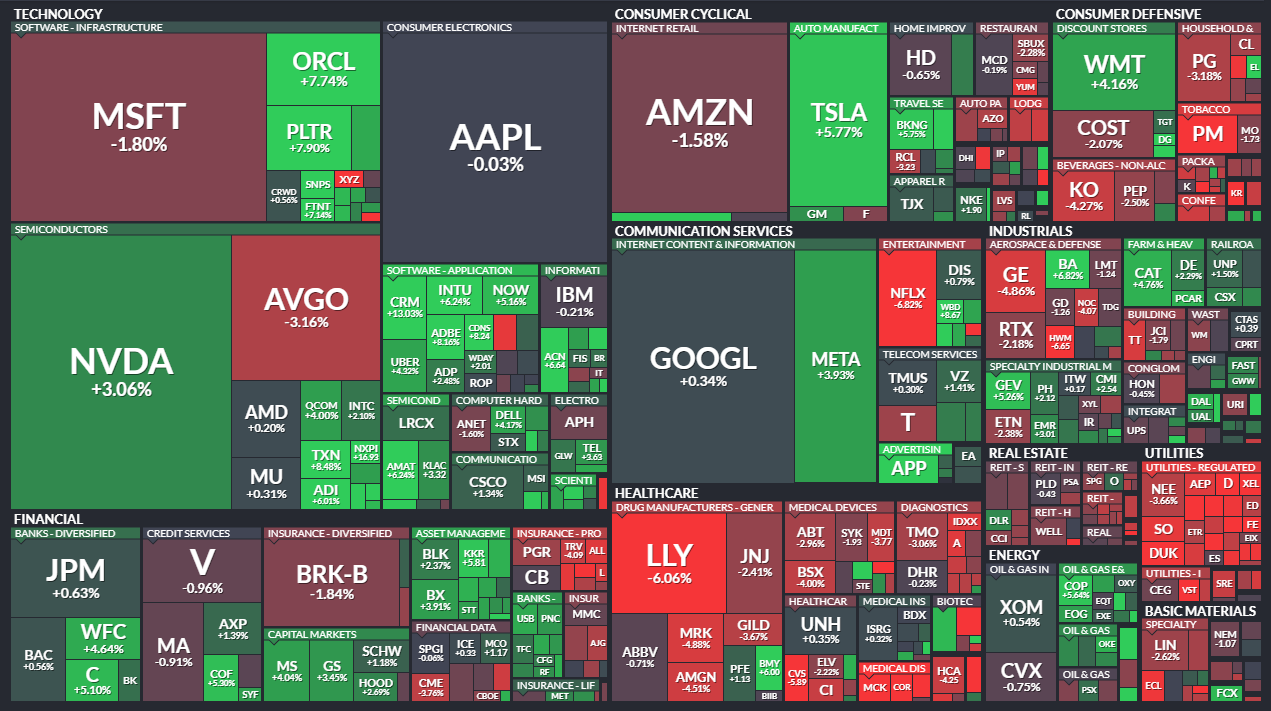
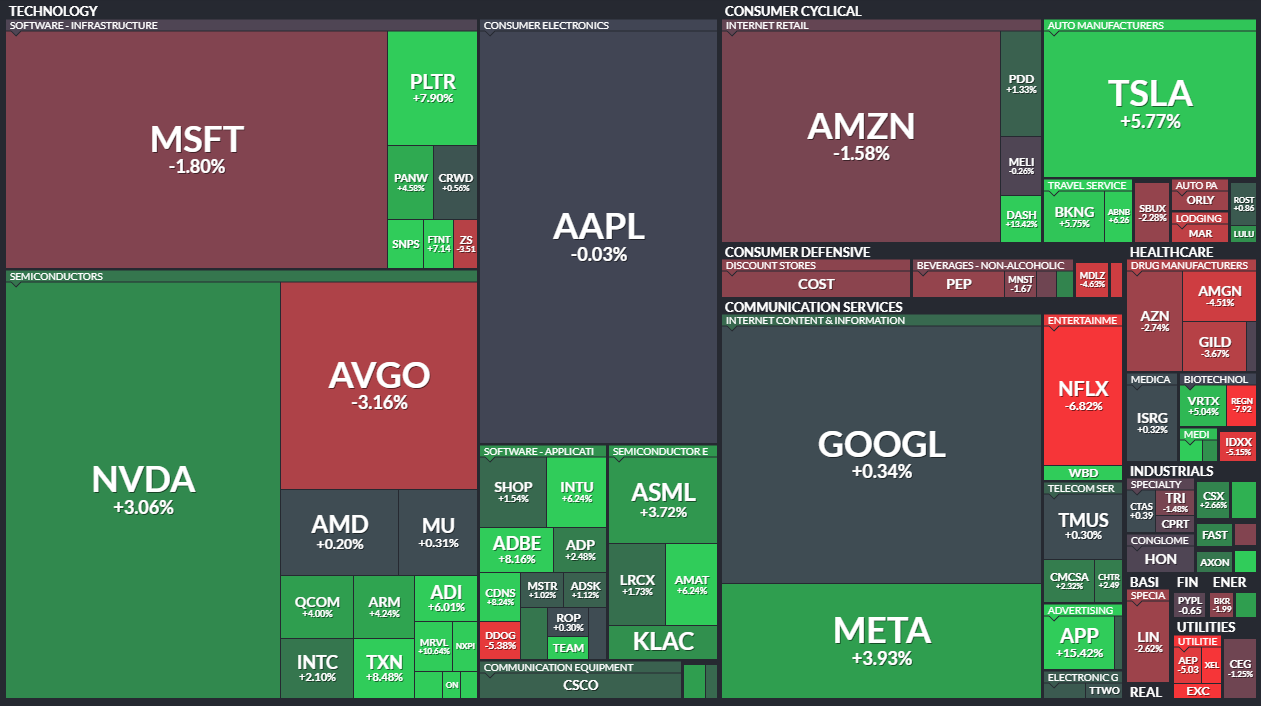
Sector performance was mixed, with 6 of 11 sectors finishing higher on the week. Energy led, aided by higher crude and gas prices. Tech was also near the top of the leaderboard, driven primarily by semiconductors rather than the usual mega-cap suspects.
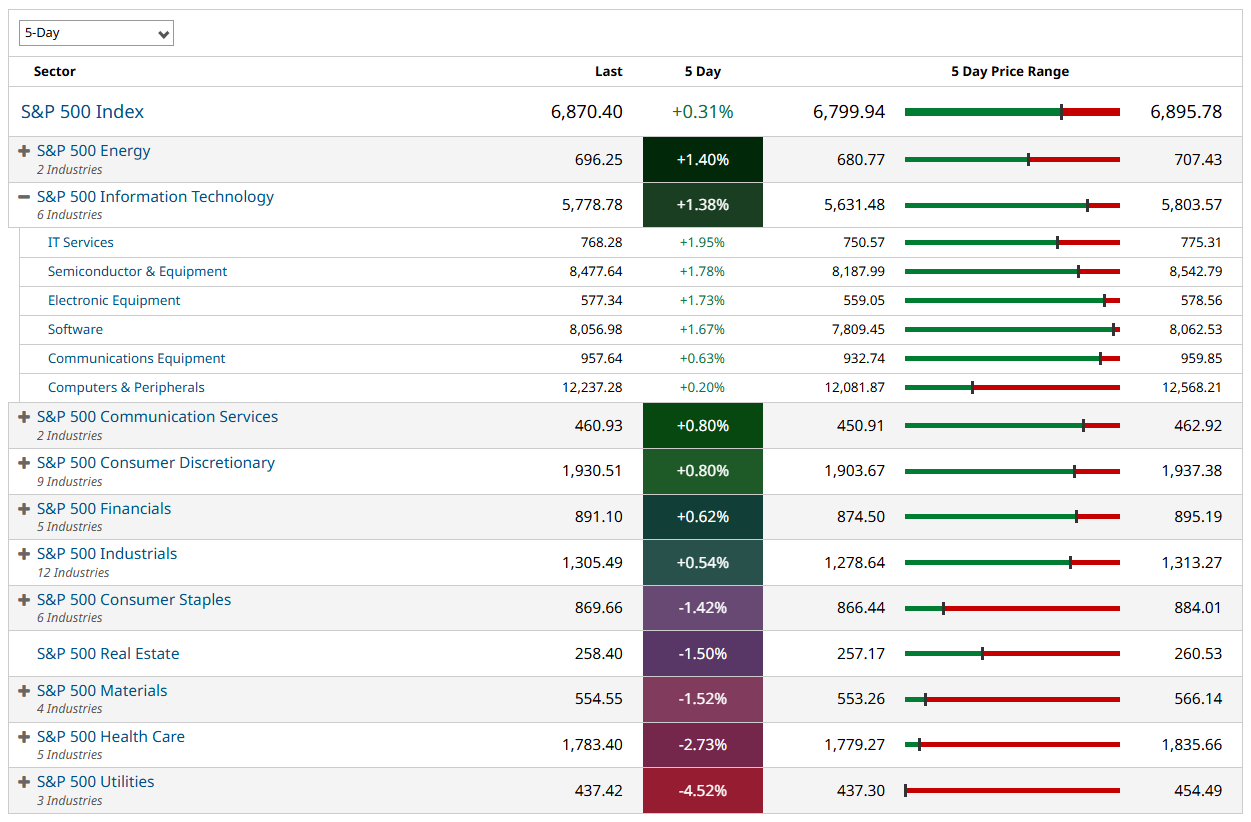
Strength in chipmakers was a clear bullish factor. Micron Technology (MU) gained more than 4%, GlobalFoundries (GFS) added more than 3%, and Intel (INTC) and Broadcom (AVGO) each rallied more than 2%. Microchip Technology (MCHP), Texas Instruments (TXN), NXP Semiconductors NV (NXPI), Analog Devices (ADI), and Lam Research (LRCX) were all up more than 1%. That breadth across analog, digital, auto-focused, and foundry names matters; it suggests that this leg of the cycle is not solely about one or two hyperscale cloud buyers, but about a broader capital expenditure push across multiple end markets. Microchip Technology (MCHP) also positively pre-announced, and more auto-centric names such as NXP Semiconductors NV (NXPI) and ON Semiconductor (ON) saw strong gains.
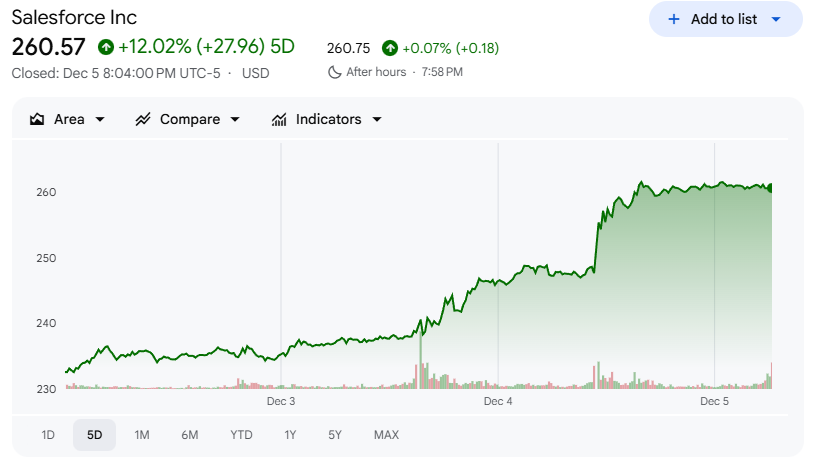
Software had its own leadership. Salesforce (CRM) led the Dow Jones Industrials, tacking on more than 5% Friday on top of a 3% gain the day before after raising its 2026 adjusted EPS forecast. In communication services, Meta Platforms (META) gained roughly 4% on the week on reports that it is substantially cutting spending on metaverse development. That shift away from a capital-intensive, low-visibility project helps the near-term margin story, even if it complicates the longer-term marketing narrative.
Financials also gained as yield spreads widened and labor data came in generally supportive of credit quality. Value-oriented and discount retailers climbed on the back of solid Black Friday and Cyber Monday data and constructive earnings commentary, even as the underlying message from those value-focused chains may be that the consumer is still hunting for bargains.
The laggards moved more sharply in percentage terms. Utilities fell around 4% in broad fashion as higher yields reduced the appeal of defensive yield plays. Healthcare continued to pull back after a strong run beginning in late September. Life science tools, managed care, and biopharma were under pressure, with new vaccine recommendation rollbacks by the CDC re-igniting regulatory and political concerns around portions of the group. Consumer staples, real estate, and materials also posted broad-based weakness.
Narrative-driven and thematic baskets, such as the quantum computing group that has been a recurring reference point this year, held up well and largely saw strong gains. Some of that can be tied back to residual impact from recent executive orders, including the AI-focused Genesis Mission, and indications from the administration that more announcements are coming around robotics and artificial intelligence. Small-cap growth in these pockets was particularly notable given that treasury yields were rising and global yields were moving higher in unison.
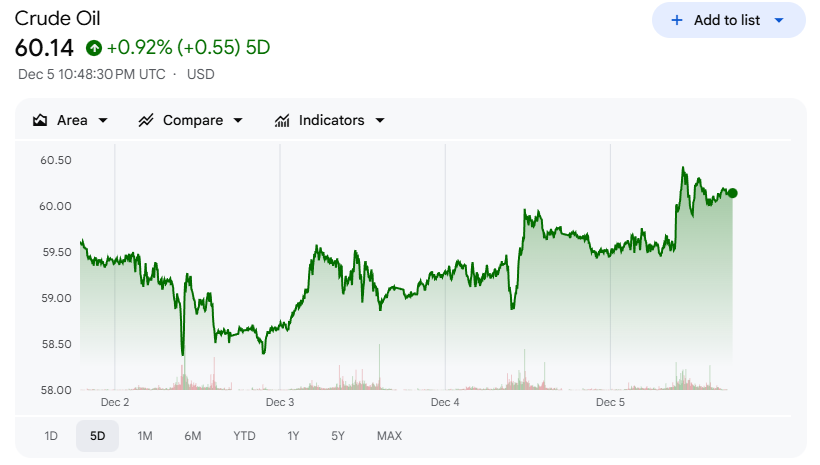
In energy, Brent crude continued its recovery from recent lows near 61 dollars and broke through its 50-day moving average around 63 dollars on Friday. OPEC+ maintained its plan to pause quota increases in the first quarter of 2026, helping to anchor expectations for supply discipline. U.S. natural gas prices rose on the week and spiked on Friday as colder weather forecasts and lower production outlooks hit the tape. Dutch gas prices moved the other way, falling 5% on the week to levels not seen since April 2024.
Metals were mixed. Copper and silver rose, while other precious metals pulled back. Gold consolidated after last week’s strong gain and an early-week test of 4,300 dollars, while the real fireworks were in silver. From Wednesday to Monday, silver spiked roughly 16%, then spent the rest of the week trading largely within Monday’s range and testing 60 dollars on Friday. A cursory scan of social media would give you enough silver experts and conspiratorial narratives to fill an entire weekend, but from a technician’s standpoint the key takeaway is that such vertical moves often precede choppy consolidation rather than straight-line continuation.
In agriculture, performance was mixed, with wheat among the standouts, up about 3% on the week. For some of us, any mention of wheat immediately calls to mind the book “The Day the Crayons Quit,” where the beige crayon laments being used only to draw wheat fields and turkey dinners. That feels about right for a market that has seen far more excitement in metals and crypto than in grains.
Crypto had another volatile week. Bitcoin traded below 90,000 dollars on Friday after failing to retake its 20-day moving average near 92,500 dollars. Ether briefly pushed above its own 20-day but stalled at 3,200 dollars and drifted back to test that moving average again on Friday. Policy headlines added to the noise. The People’s Bank of China reiterated that digital assets remain illegal in China, while Vanguard announced that it will allow customers to trade crypto ETFs, reversing a policy stance that had made it an outlier among major asset managers.
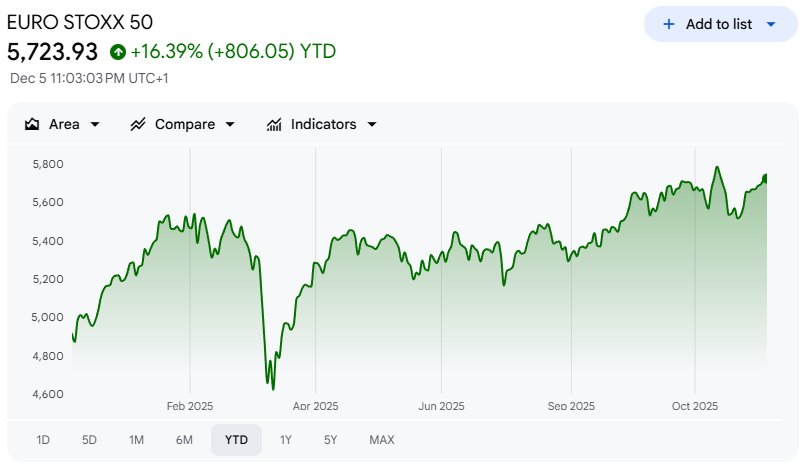
In Europe, the Euro Stoxx 50 rose to a 3-week high and closed up 0.10% on Friday. For the week, major European indexes were mixed. Germany’s DAX was a leader, gaining close to 1%, while the FTSE 100’s 0.6% decline left it near the bottom of the regional pack. The DAX closed above its 50-day and 100-day moving averages on Friday after regaining its 200-day last week. Auto stocks found support from the U.S. administration’s move to lower fuel economy standards. Initial optimism around U.S. meetings with Russian President Vladimir Putin faded as key sticking points remained unresolved, and Germany only narrowly avoided a French-style government crisis over a contentious pension bill that left Chancellor Friedrich Merz’s leadership on a precarious ledge.
In Asia, Japan’s Nikkei Stock Average was modestly higher on the week, with big moves on Monday and Thursday largely cancelling each other out. Robotics and related companies benefited from U.S. policy headlines that prioritized the industry as part of broader AI and automation initiatives. Hawkish commentary from the Bank of Japan added to expectations that a rate hike could come as soon as this month, and 10- and 30-year JGB auctions were well received.
China’s Shanghai Composite finished up 0.70% on Friday and was modestly higher on the week despite sluggish PMI data. Policy communication continues to walk a fine line between supporting growth and managing structural risks.
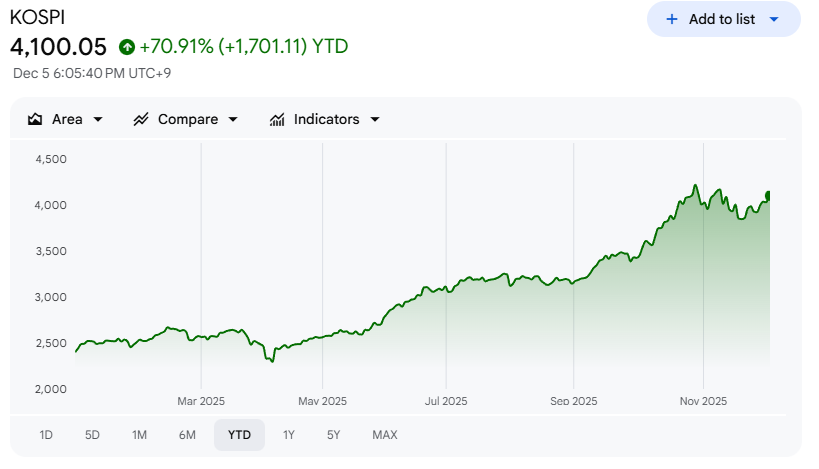
South Korea once again stood out. The Kospi gained roughly 4% after Commerce Secretary Lutnick confirmed that the U.S. will lower tariffs on South Korean imports to 15% in response to the country’s advancement of legislation committing around 350 billion dollars of investment into the United States. That tariff relief and investment commitment, layered on top of Korea’s leverage to global technology and robotics themes, kept the Kospi near the front of the regional pack.
As we enter the final stretch of 2025, markets have delivered double-digit gains across major U.S. indexes. The S&P 500 is up about 17% year to date, while the technology-heavy Nasdaq is up roughly 22%. Since the April lows, the S&P 500 has gained about 38% with only a single 5% pullback, which occurred in November. Against that backdrop, three catalysts stand out as we move through December and into 2026: the Fed’s December meeting, the November nonfarm payrolls report, and the potential Santa Claus rally.
First, the Fed. The December 9–10 meeting will set the tone for policy in 2026. Market pricing assigns about a 90–95% probability to a 25 basis point cut. If Chair Powell delivers the expected cut and signals a path toward a neutral fed funds rate in the 3.0%–3.5% range over the coming year, the market will likely interpret that as confirmation that the Fed is easing because policy has been too restrictive, not because recession is imminent. Historically, when the Fed is cutting rates in the context of an economy that is still growing at or near trend, risk assets tend to perform relatively well. By contrast, when rate cuts are reactive to a sharp deterioration in growth, equity performance has been much weaker.
Second, the November nonfarm payrolls report on December 16 will provide a clean read on labor conditions after the data disruptions from the October government shutdown. Expectations call for 38,000 jobs added, an unemployment rate ticking up to 4.5%, and wage growth easing to 3.6% year over year. Combined with ADP’s negative private payrolls print for November, the fourth decline in six months, and the ongoing divergence between small and large employers, this report will be critical in shaping expectations for how far and how fast the Fed can ease without re-igniting inflation. At the same time, continued sub-200,000 weekly jobless claims around 191,000 would be a powerful counterweight to any narrative of imminent labor market collapse.
Third, the question of whether Santa will show up. The Santa Claus rally window—the last five trading days of the year plus the first two trading days of January—has historically been positive 73% of the time since 1980, with an average S&P 500 gain of 1.1%. With indexes sitting near record highs after a 38% run from the April lows, even a modest 1% seasonal tailwind would be additive. But more important than the exact Santa Claus statistics is what the pattern of returns around year-end tells us about investor positioning. Strong gains into year-end, particularly with the VIX below 16, would suggest that investors are comfortable carrying risk into 2026. A failed Santa pattern, especially if accompanied by a spike in volatility and weak breadth, would argue for more caution.
Positioning into 2026
After three consecutive years of stock market gains, many investors who started with a classic 60% stocks / 40% bonds allocation now find that their portfolios look more like 70% stocks or higher. With the S&P 500 up about 17% year to date and the Nasdaq up about 22%, that drift is not surprising. But it does raise the question of whether portfolios are still aligned with intended risk targets.
From a technician’s perspective, the tape is saying that the path of least resistance remains higher as long as the S&P 500 holds the 6800–6900 range and breadth remains reasonably healthy, particularly in small caps and equal-weight indexes. The fact that small caps have led on several recent up days, that narrative-driven baskets in AI and quantum computing continue to make new highs, and that semiconductors across the value chain are breaking out together, all point to a market that is comfortable looking through short-term macro noise toward a 2026 environment of lower rates and ongoing technology investment.
From a portfolio construction standpoint, it is a sensible time to check allocations. Rebalancing back toward intended weights can crystalize gains and reduce concentration risk without requiring a sharp directional call on the market. Within equities, there is a case for maintaining exposure to U.S. large caps that are leveraged to AI and broader tech themes, while leaning a bit more into U.S. mid caps, which tend to be more cyclically sensitive and have scope for catch-up if the Fed continues to ease and the expansion continues.
There is also an argument for looking beyond U.S. borders. Emerging market equities can benefit when the Fed is cutting rates, both through the currency channel and through improved global growth expectations, and many EM markets offer direct exposure to the same global technology and robotics themes that are driving returns in the U.S. International small- and mid-cap stocks, meanwhile, come with relatively favorable valuation starting points after years of underperformance.
Style-wise, an equal-weight stance between growth and value still makes sense. Value and cyclical equities—including financials, industrials, and certain energy and materials names—have room to outperform if the rate path is lower and the economy avoids a hard landing. At the same time, technology and AI-linked growth baskets remain central to the structural story investors are paying for. An equal-weight approach between the two camps recognizes that both can work in an environment where the Fed is cutting and inflation is contained.
Finally, it is worth keeping an eye on the policy and political calendar. The Fed’s December decision, the pace of cuts in 2026, the eventual appointment of a new Fed Chair in early 2026, ongoing tariff decisions, and evolving regulation in areas like digital assets and health care will all shape sector-level winners and losers. The market has already shown how quickly it reprices regulatory risk in managed care and how sensitive crypto-exposed stocks are to both domestic and international policy headlines.
For now, though, the message of the tape is straightforward. The S&P 500 sits near all-time highs after a 38% climb from the April lows. The VIX has compressed from 26 to below 16. Core PCE is running at 2.8% year over year, and both survey-based and market-based inflation expectations are drifting lower. Private payrolls are choppy, but initial claims are still hovering near 191,000. Long-term yields have pushed back above 4.1% but remain below their peaks, and credit spreads are broadly well-behaved.
In that environment, the burden of proof is on the bears. If the Fed delivers a 25 basis point cut next week and signals a steady march toward neutral without flagging imminent recession, if the November jobs report looks more like a controlled cooling than a collapse, and if Santa shows up even modestly, the path into 2026 could look a lot like the path we have been on since April: grinding higher, with volatility spikes that are better used for risk management and rebalancing than for wholesale derisking.
Weekly Benchmark Breakdown
Market breadth this week reflects a steady, constructive tone rather than a true momentum ignition. Across the major indexes, short-term participation is firm, intermediate-term participation is mixed but improving, and longer-term participation remains supportive. This is not the kind of tape that signals exhaustion or fragility, but it also stops short of delivering a clean breadth thrust. Risk appetite is present, but it is being expressed in a measured way rather than through a decisive surge in participation.
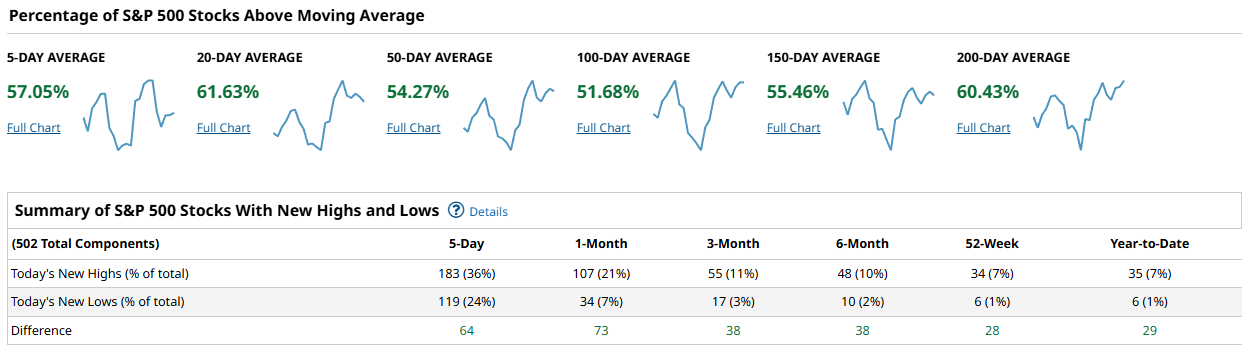
The S&P 500 enters the week with 57.05 percent of constituents above their 5-day average and 61.63 percent above the 20-day, a solid near-term base that confirms upside traction has not faded. At the intermediate horizon, 54.27 percent remain above the 50-day, and only 51.68 percent sit above the 100-day. Longer-term measures improve modestly, with 55.46 percent above the 150-day and 60.43 percent above the 200-day. This structure shows the index is being supported more by shorter and longer horizons than by the middle of the curve, a configuration that often reflects a market still rebuilding intermediate trend strength. New highs minus new lows reinforce that message. Over 5 days the spread is +64, over 1 month it is +73, and even at 3 and 6 months it holds at +38. The 52-week spread at +28 and year-to-date at +29 confirm that upside leadership remains intact, though it is not aggressively expanding.
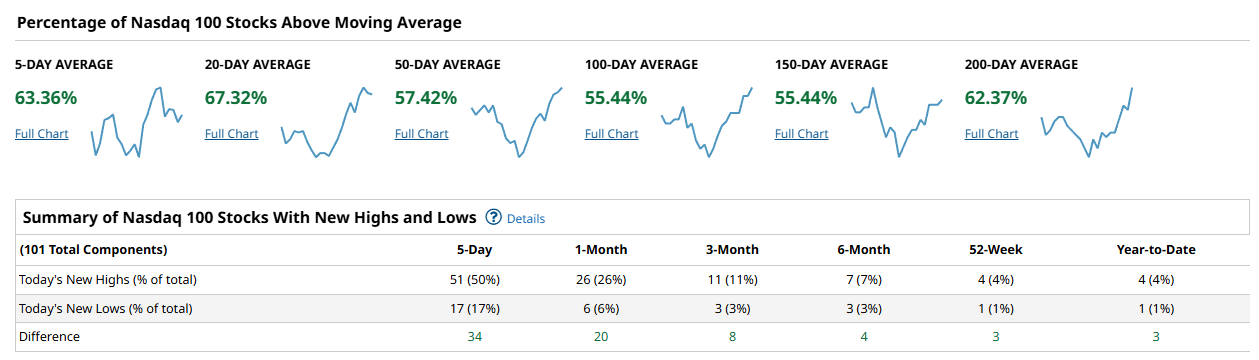
The Nasdaq 100 continues to lead participation, especially at the front of the curve. 63.36 percent of components are above the 5-day average and 67.32 percent above the 20-day, the strongest short-term readings across the four groups. The 50-day measure is 57.42 percent, while both the 100-day and 150-day rest at 55.44 percent. The long-term trend remains notably firm, with 62.37 percent above the 200-day. New highs versus new lows echo this leadership profile. Over 5 days, the spread is a robust +34, with +20 at 1 month, +8 at 3 months, and still positive at +4 at 6 months. The 52-week and year-to-date spreads both hold at +3. This is not a runaway advance, but it is persistent leadership with steady follow-through across multiple lookbacks.
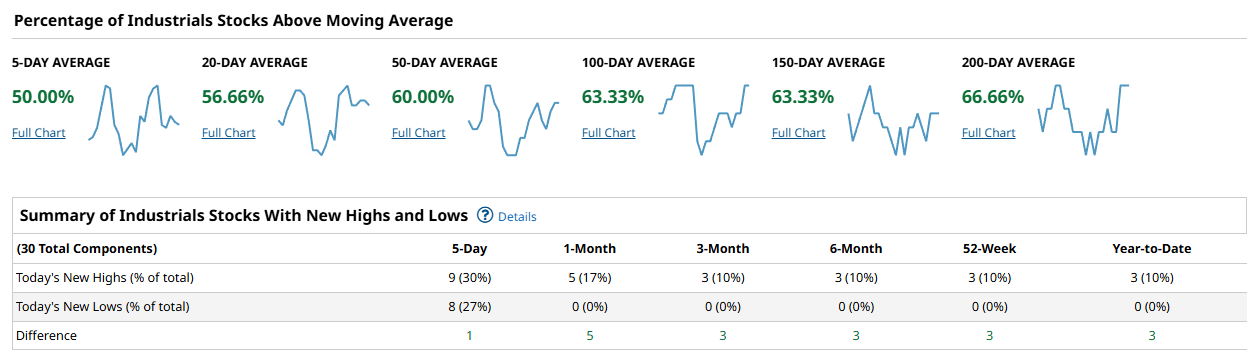
The Dow Industrials present a more balanced but less forceful picture. Exactly 50.00 percent of components are above the 5-day average, and 56.66 percent remain above the 20-day. Participation strengthens meaningfully at the 50-day with 60.00 percent above trend, and improves further at both the 100-day and 150-day with 63.33 percent at each. The 200-day reading stands at 66.66 percent, the strongest long-term figure among the large-cap benchmarks. However, the new high minus new low spreads are modest. The 5-day spread is only +1, with +5 at 1 month and +3 across 3-month, 6-month, 52-week, and year-to-date horizons. This tells the story of a market that is trend-stable but not accelerating in terms of leadership expansion.
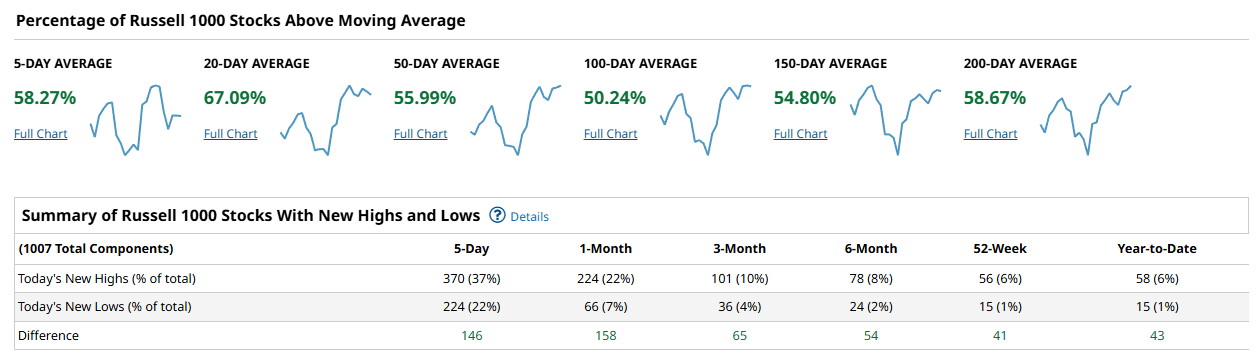
The Russell 1000 offers one of the clearer signs of broad participation returning underneath the surface. Short-term participation measures 58.27 percent above the 5-day and 67.09 percent above the 20-day. The 50-day sits at 55.99 percent, while only 50.24 percent remain above the 100-day. Longer-term participation improves again, with 54.80 percent above the 150-day and 58.67 percent above the 200-day. The most striking element here is the new highs minus new lows profile. Over 5 days the spread is +146, at 1 month it climbs to +158, with +65 over 3 months, +54 over 6 months, and still +41 at 52 weeks and +43 year-to-date. This is clear evidence that leadership and participation are materially broader here than in the cap-weighted benchmarks.
Taken together, the cap-weighted indexes continue to show healthy but contained participation, while the broader Russell 1000 reveals stronger internal expansion. The Nasdaq 100 remains the short-term participation leader, but the Russell 1000 is doing the heavier lifting in terms of net new highs over new lows. The S&P 500 sits between those two profiles, supported by short-term and long-term participation but still rebuilding its middle layers. The Dow is quietly strong on long-term trend but lacks thrust in its leadership spreads. For this market to confirm a durable advance, the 50-day cohorts across SPX and R1000 would need to push decisively above 60 percent while new highs continue to outnumber new lows by wide margins across all lookbacks. A failure of short-term participation, especially if the 20-day readings roll back below 50 percent while new lows begin to expand, would justify near-term caution.
Broadly, this is still a tape that favors exposure over excessive defensiveness, but with selectivity. Areas tied to the Nasdaq 100 and the broader Russell 1000 complex continue to offer the best internal support, while Dow-style exposure appears better suited for stability than for momentum seeking. Chasing strength is less attractive than leaning into pullbacks that hold above rising short-term participation thresholds. What matters most this week is whether the 50-day participation readings can continue grinding higher rather than stalling in the mid-50s. If that improvement persists alongside positive new high minus new low spreads, the market’s internal structure remains aligned with further upside. If instead short-term participation slips back toward the low-50s without a corresponding improvement in the intermediate cohort, the risk tone would shift from constructive to range-bound.

Investor Sentiment Report
%Bull-Bear Spread
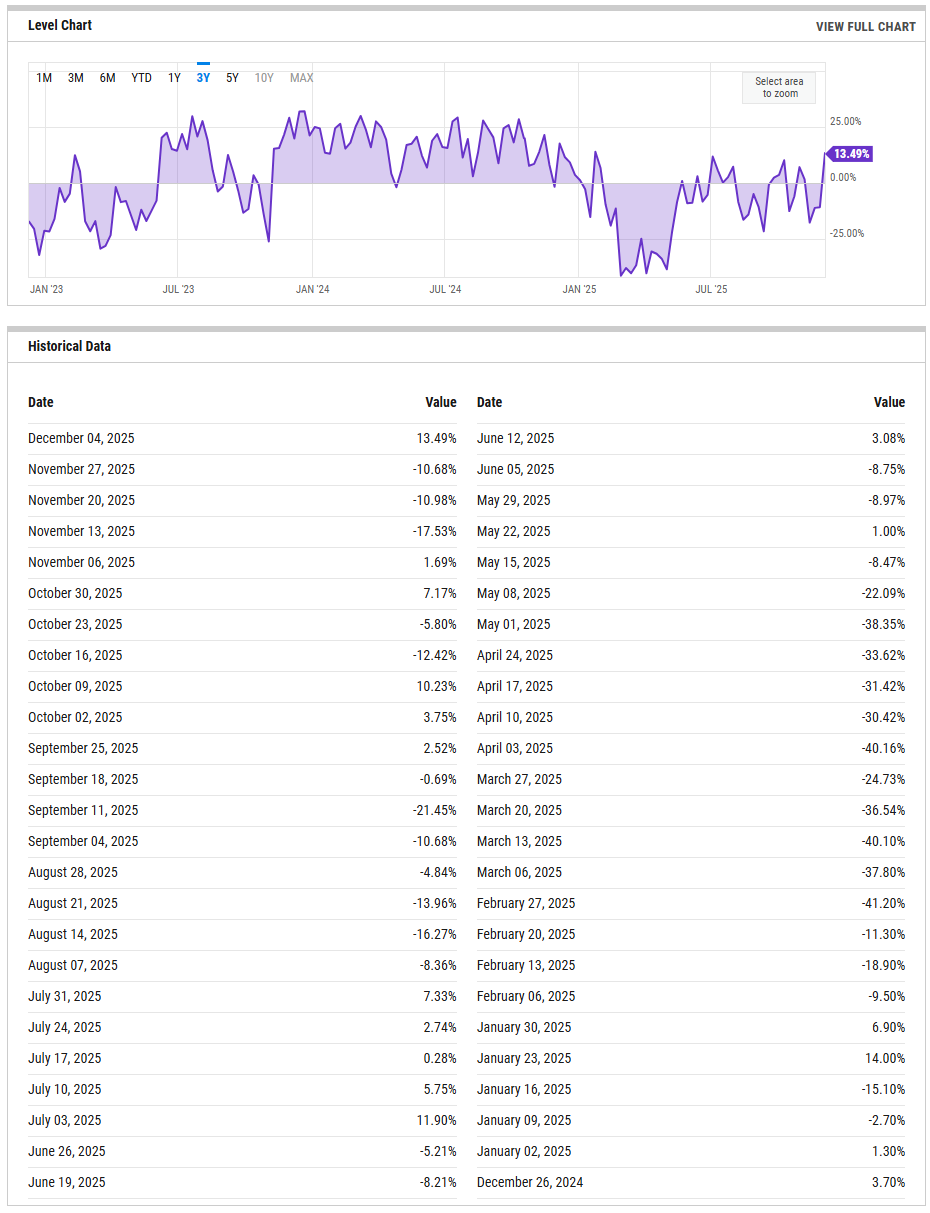
The %Bull-Bear Spread measures the gap between bullish and bearish investor sentiment, often from surveys like AAII. It’s a contrarian indicator—extreme optimism may signal a coming pullback, while extreme pessimism can hint at a potential rally. Large positive or negative spreads often mark market turning points.
The percent bull minus bear spread has turned decisively positive again, with the latest reading at 13.49 percent as of December 4, 2025. This follows an extended negative stretch through most of late November, when the spread ranged roughly from minus 10 to minus 18 percent, and stands in sharp contrast to the deeply pessimistic trough earlier this year when readings pushed into the minus 40 percent zone. The rebound confirms that fear has eased and optimism is recovering, but the market is not yet in a sentiment extreme. At just over +13, positioning has shifted out of a contrarian buy zone and into a more neutral-to-constructive range. This is consistent with a market stabilizing rather than overheating. The key tripwires remain clean: a move above +20 would signal a transition toward a crowded optimism regime where forward returns typically become less asymmetric, while a relapse back below zero would indicate that confidence is once again failing and that downside risk is reasserting itself.
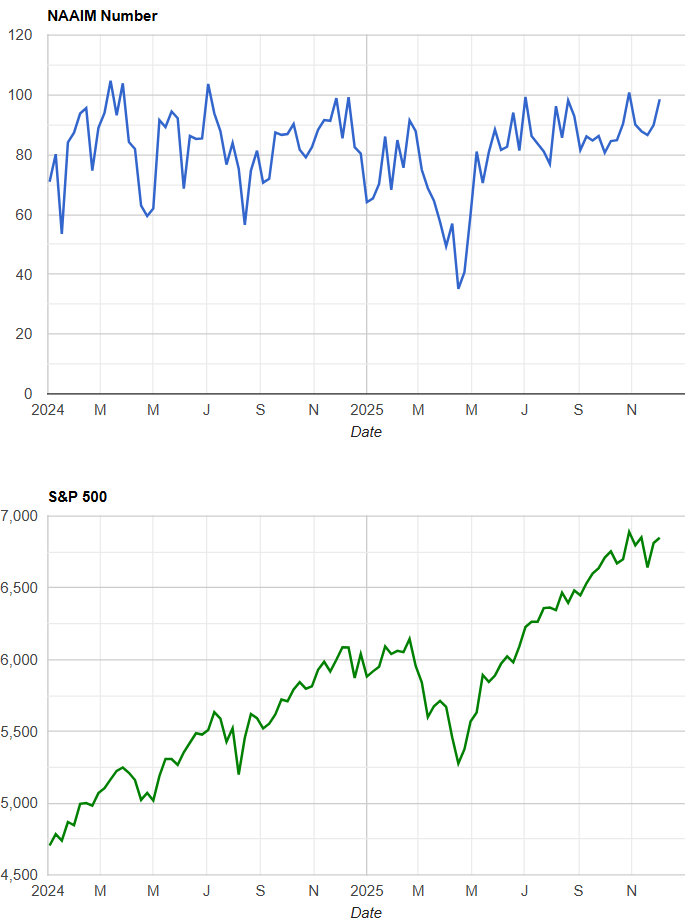
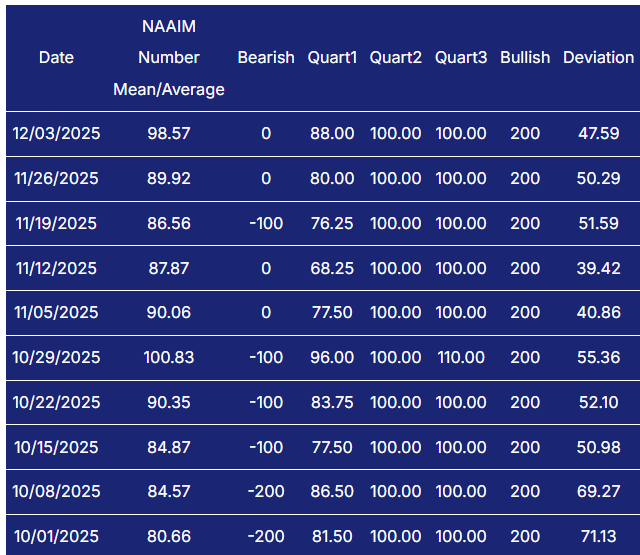
NAAIM Exposure Index
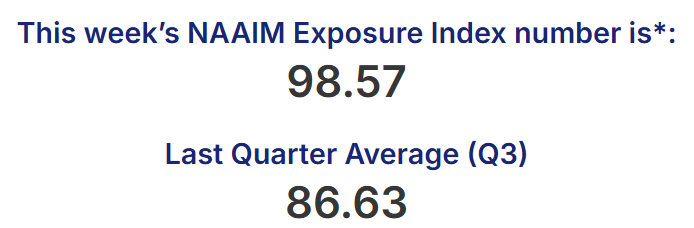
The NAAIM Exposure Index (National Association of Active Investment Managers Exposure Index) measures the average exposure to U.S. equity markets as reported by its member firms. These are typically active money managers who provide their equity exposure levels weekly. The index offers insight into how much these managers are investing in equities at any given time, ranging from being fully short (-100%) to leveraged long (up to +200%).
The NAAIM Exposure Index confirms that active managers have responded to the improvement in tone by reloading risk. The latest reading on December 3 is 98.57, a sharp step up from the mid-to-high 80s of recent weeks and effectively a return to near full investment. Several October and November readings already printed near or above 100, so this is clearly not a tentative reentry of exposure but an aggressive recommitment. This posture implies that a large portion of available dry powder has already been deployed, leaving the market more sensitive to any adverse price movement. Elevated exposure does not cap upside on its own, but it does increase the risk that any downside impulse could be amplified by forced de-risking. A pullback in NAAIM toward the 50s without material index damage would be constructive and reset optionality. A sustained run above 90 to 100, however, increases the market’s dependence on continued upside momentum to avoid positioning stress.
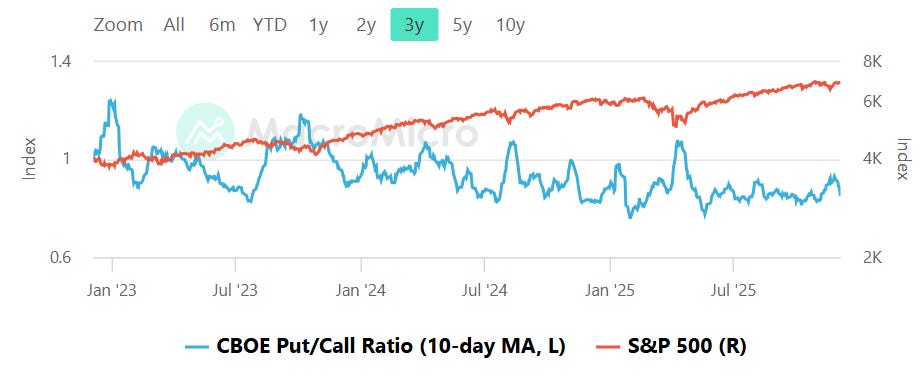
CBOE Total Put/Call Ratio
CBOE's total put/call ratio includes index options and equity options. It's a popular indicator for market sentiment. A high put/call ratio suggests that the market is overly bearish and stocks might rebound. A low put/call ratio suggests that market exuberance could result in a sharp fall.
The 10-day moving average of the CBOE total put/call ratio sits below 1.0 and has been drifting lower over recent months, indicating a steady bias toward call demand rather than a panic-driven appetite for protection. Visually, the ratio has oscillated in a relatively tight band, well removed from the fear spikes seen during prior corrections. This profile is consistent with steady risk-taking rather than speculative excess. In practical terms, it suggests that drawdowns are likely to remain relatively contained as long as call demand dominates but are also unlikely to see the kind of explosive rebound that typically follows true capitulation. The key tripwires here remain the classic bands: a sustained dip into the low 0.80s would flag froth and complacency, while a surge through 1.0 and toward 1.10 or higher would reflect a sudden demand for crash protection and elevate the odds of a tradeable low forming. Until either extreme is reached, the options market is signaling balanced confidence with a mild pro-risk tilt.
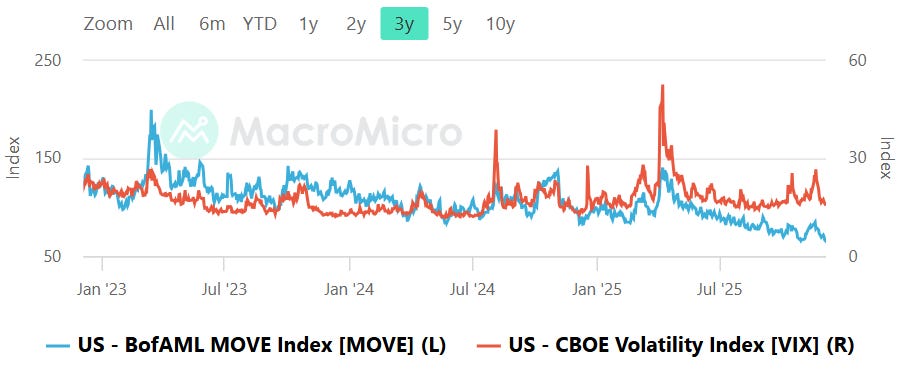
Equity vs Bond Volatility
The Merrill Lynch Option Volatility Estimate [MOVE] Index from BofAML and the CBOE Volatility Index [VIX] respectively represent market volatility of U.S. Treasury futures and the S&P 500 index. They typically move in tandem but when they diverge, an opportunity can emerge from one having to “catch-up” to the other.
Both equity and bond volatility continue to compress, with the VIX holding at subdued levels and the MOVE index trending lower as well after the violent spikes seen earlier in the year. The most recent portion of the chart shows no active stress signal from rates markets and no meaningful repricing of equity risk. This alignment is important: the most destabilizing environments tend to emerge when bond volatility surges ahead of equity volatility, effectively warning that liquidity or policy transmission is becoming disorderly. That is not the case at present. Instead, both markets are telegraphing relative calm. The primary tripwires remain structural. A renewed MOVE surge back toward the 120 zone while the VIX remains suppressed would be an early warning of trouble under the surface. Conversely, a VIX push into the high teens would mark the first meaningful repricing of equity risk since this latest sentiment recovery. As long as both series remain jointly restrained, the backdrop favors trend persistence rather than shock.
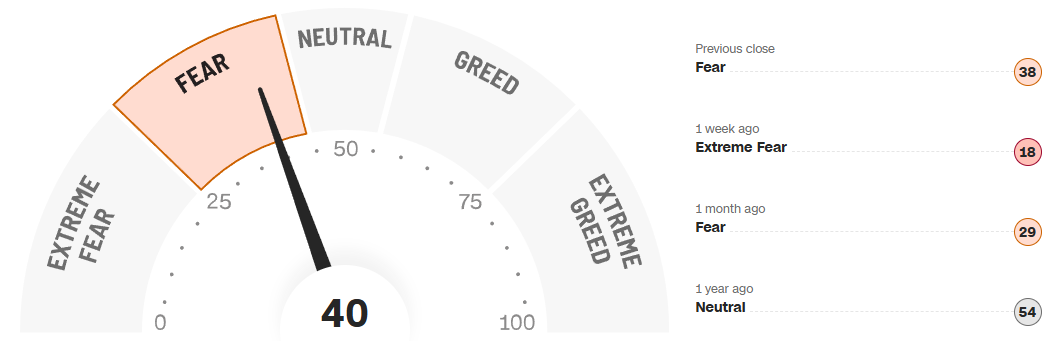
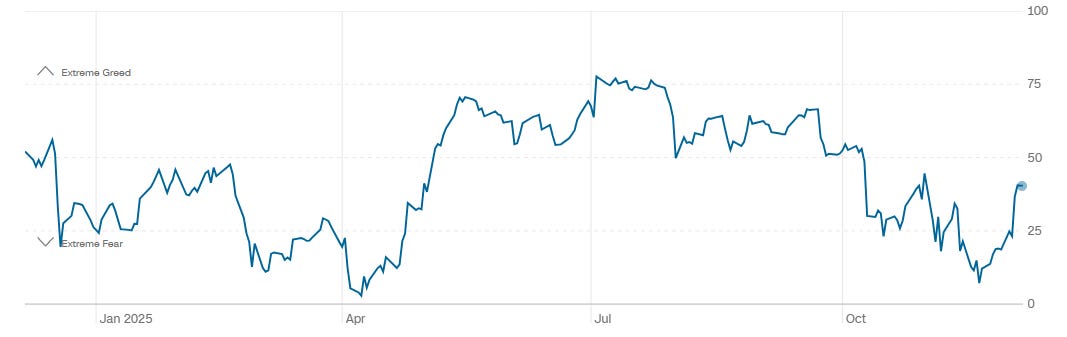
CNN Fear & Greed Constituent Data Points & Composite Index
The CNN Fear and Greed composite currently registers 40, firmly in the Fear zone but well above the extreme fear lows recorded just one week ago at 18. One month ago the reading stood at 29, also Fear, while one year ago it was 54, or Neutral. The one-year trend shows sentiment cycling from fear through mid-year optimism and back into fear again in early autumn, with the latest rebound still modest in scope. This is not a market gripped by euphoria. Instead, it reflects a cautious recovery in confidence after a sharp psychological drawdown. From a tactical perspective, readings in the 30 to 45 range often correspond to constructive entry zones rather than exhaustion points. A push back toward 60 would suggest that the wall of worry has been largely climbed and that upside may become more incremental. A relapse toward 20 or below would signal renewed stress and likely coincide with another opportunity created by forced selling rather than organic distribution.
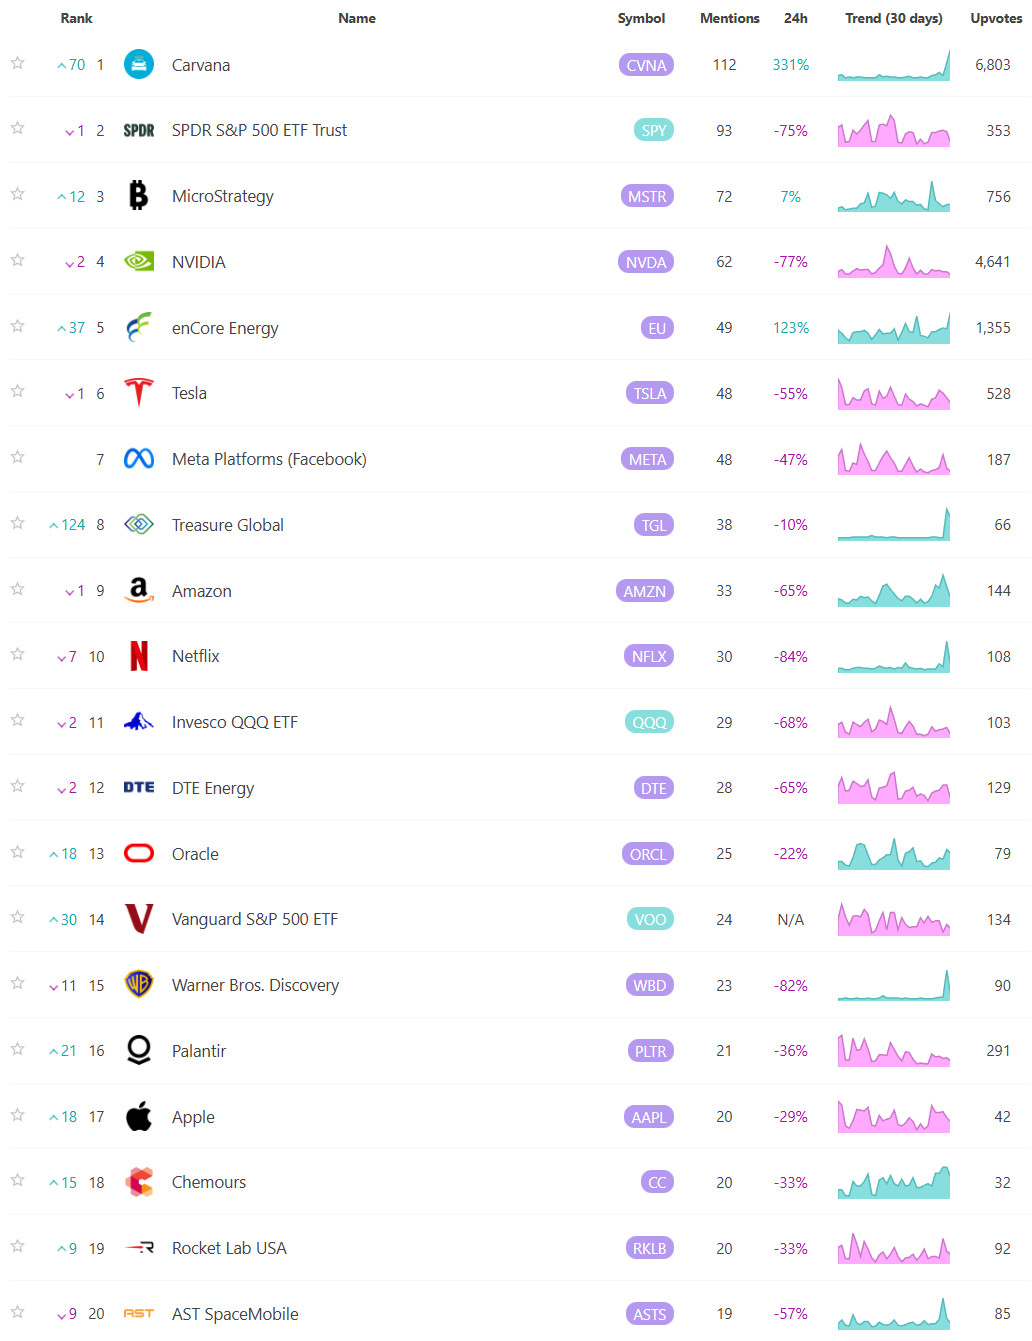
Social Media Favs
Social sentiment offers a real-time view of investor mood, often revealing market shifts before traditional indicators. It can signal momentum changes, spot emerging trends, and gauge retail investor impact—especially in high-volatility names. Tracking sentiment around events or earnings provides actionable insights, and when layered with quantitative models, can enhance predictive accuracy and risk management. Sustained sentiment trends often mirror broader market cycles, making this data a valuable tool for both short-term trades and long-term positioning.

Technician’s Playbook: Trading the Majors (SPY/QQQ/IWM/DIA)
When you’re a large institutional player, your primary goal is to find liquidity - places to do a ton of business with the least amount of slippage possible. VolumeLeaders.com automatically identifies and visually plots the exact spots where institutions are doing business and where they are likely to return for more. It’s one of the primary reasons “support” and “resistance” concepts work and truly one of the reasons “price has memory”.
The tape this week carried the classic rhythm of late-stage trend continuation: an early stumble into a well-defined accumulation shelf, followed by a persistent grind higher that resolved into tight balance near the highs. Across all four benchmarks, the story was not about explosive upside so much as orderly acceptance above prior congestion, with repeated signals that responsive buyers were willing to absorb supply rather than chase price vertically. Opening auctions earlier in the window showed hesitation and quick tests into support, while the past several sessions closed with small-bodied candles, a sign that initiative enthusiasm has cooled but has not cracked.
SPY
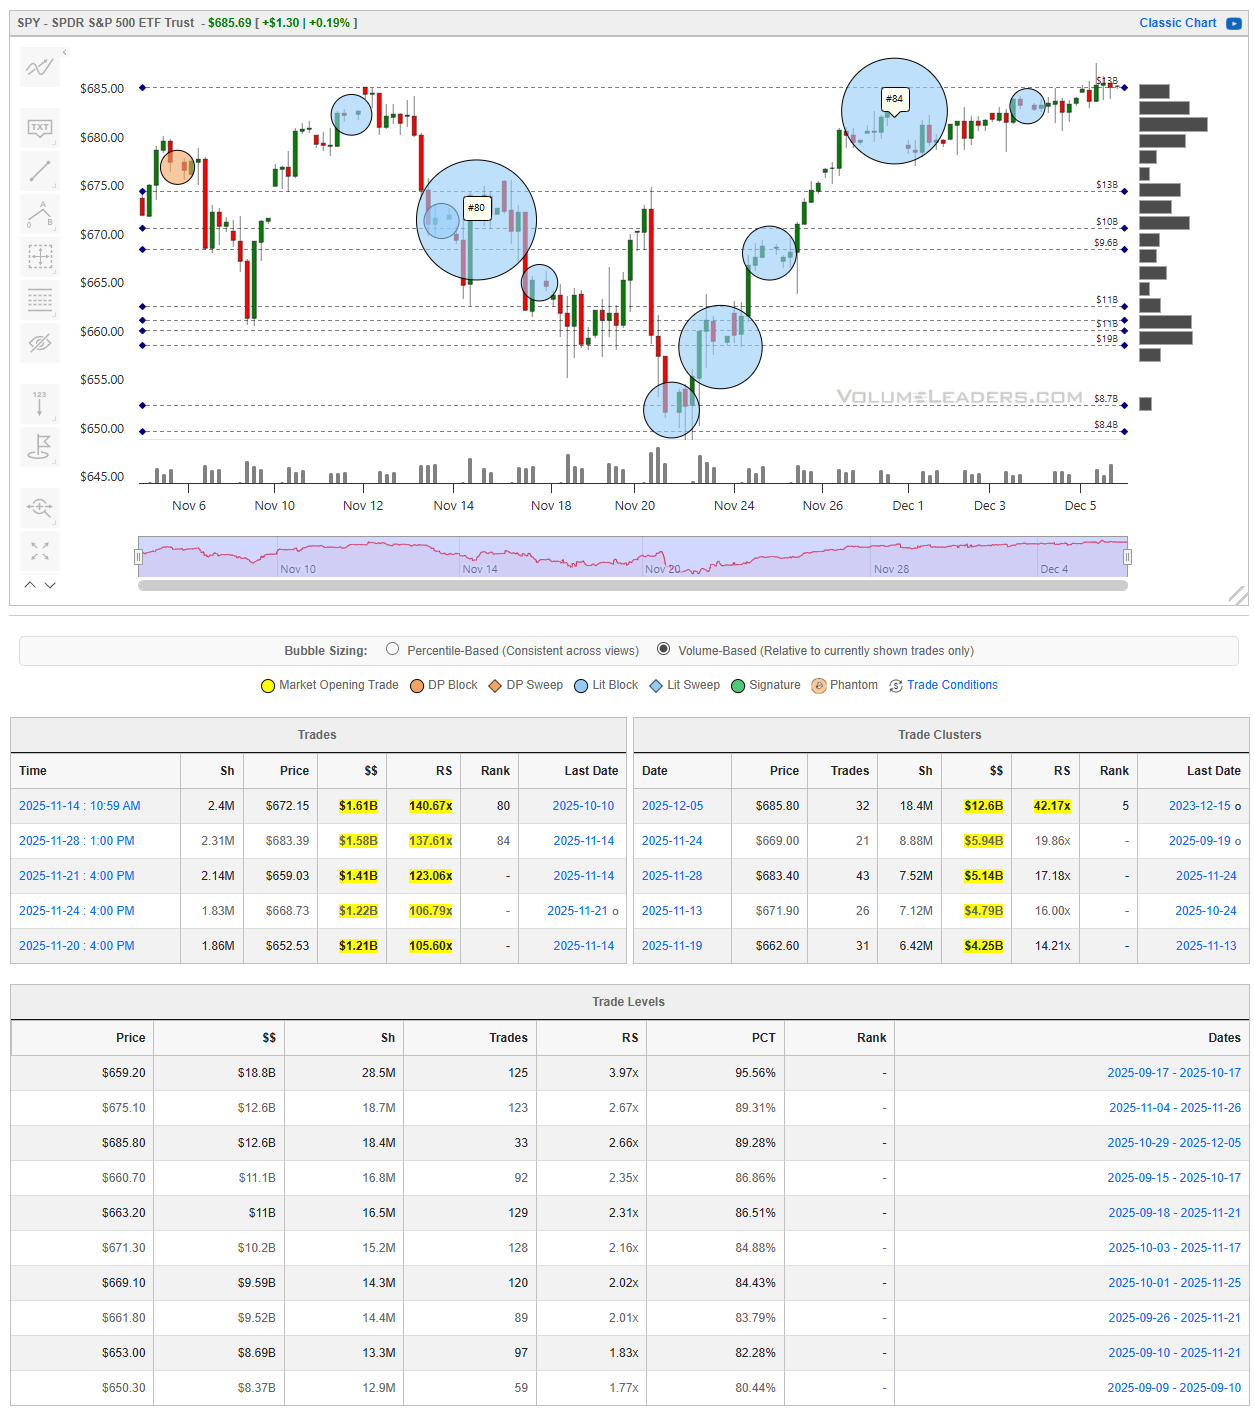
SPY printed one of the cleaner sequences of absorption and lift. Midweek weakness pressed into the low 660s, where repeated large prints appeared just ahead of the rally phase. The most prominent cluster sits at 685.80, carrying roughly $12.6B in notional and a relative size north of 42x, placing it in the extreme upper tail of recent participation. That zone now represents the dominant upside magnet and near-term battleground. Beneath it, the 669.00 and 671.90 areas stand out as secondary shelves, both built on multi-billion dollar turnover with double-digit RS readings. Earlier in the decline phase, heavy activity also accumulated near 662.60, which continues to frame the lower boundary of the current structure. Of note, a marked top-100 print tagged near the upper highs just below 685 underscores that large participants were active into strength, but price has not rejected that effort. The line of scrimmage is now clearly defined just below the 675 to 669 composite shelf. Acceptance above 685 opens the door to further price discovery. Failure back below 662 would flip the profile from continuation to failed breakout.
QQQ
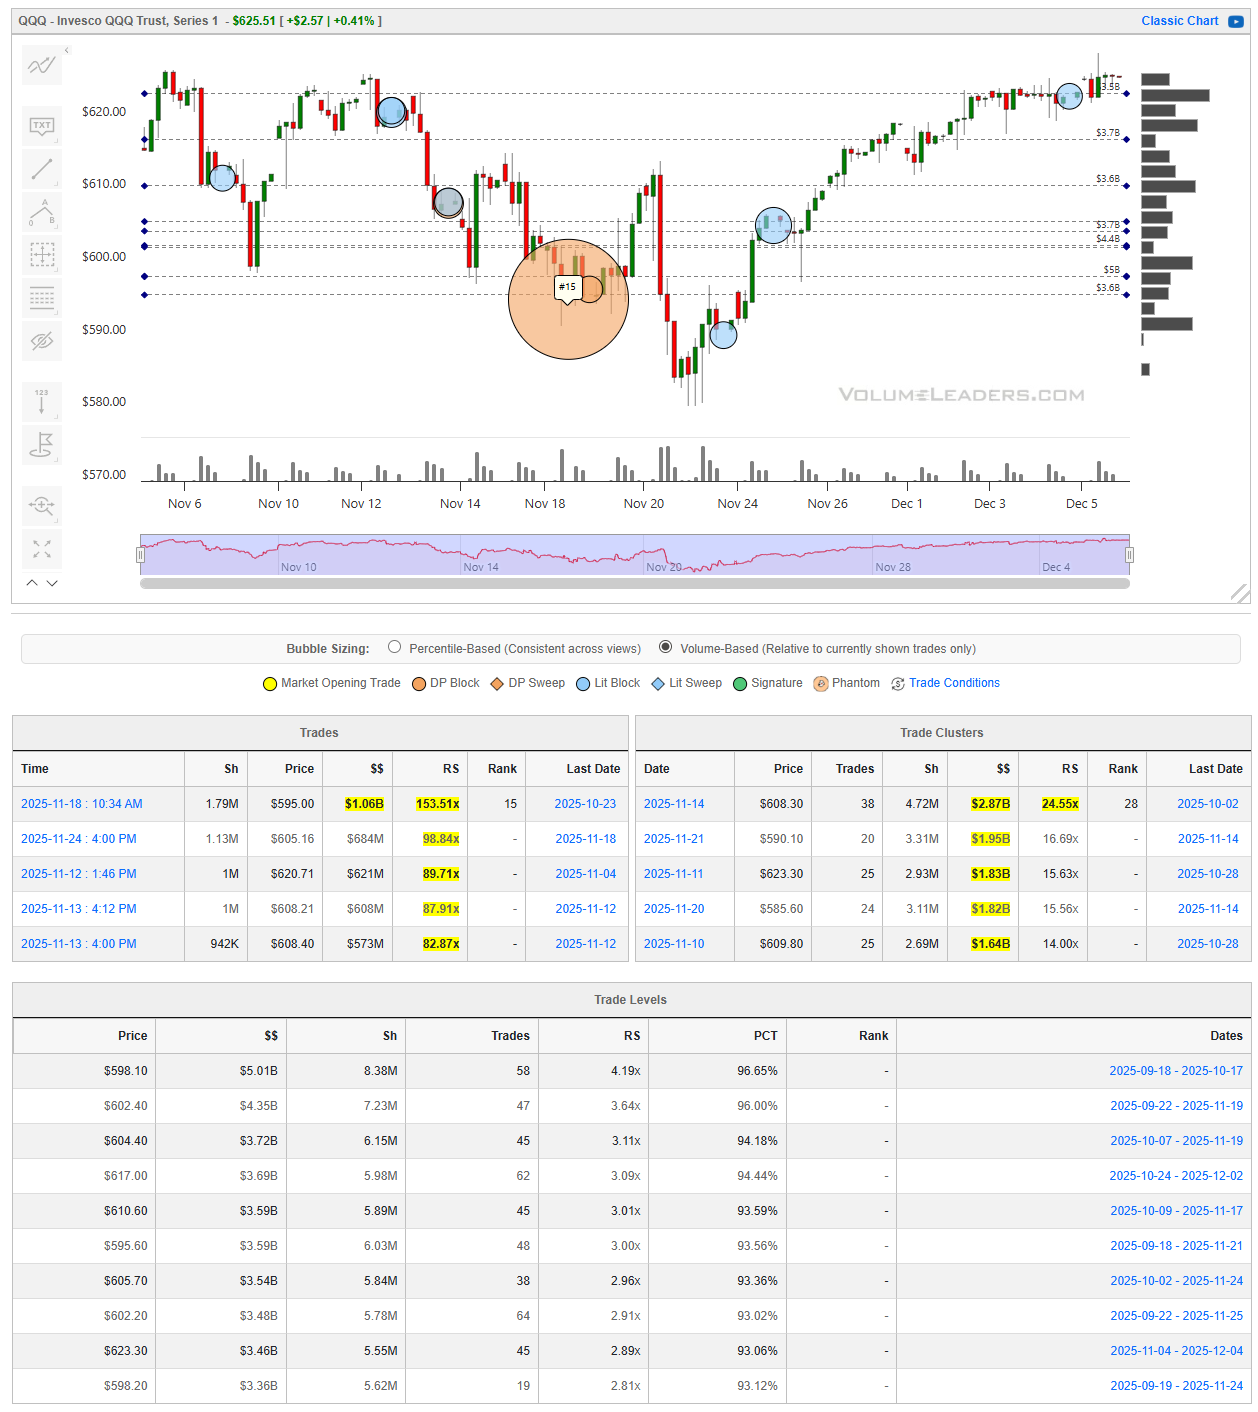
QQQ followed a nearly identical playbook but with a deeper midweek flush and more dramatic single-session absorption. The most dominant print in this window is the large tagged transaction near 595, labeled among the top historical trades, which coincided with the intraday low of the downswing. That event marked a textbook capitulation-into-acceptance sequence, as price immediately stabilized and transitioned into a steady ascent. The most active upside cluster since then sits near 608.30 with nearly $2.9B and a relative size in the mid-20s, while additional dense turnover developed at 609.80 and 623.30. On the volume profile, the richest long-term shelves reside between roughly 598 and 605, where multiple levels show $3B to $5B in cumulative notional with RS readings above 3x and percentile ranks in the mid- to upper-90s. This defines the core demand zone that underwrote the entire rebound. As long as QQQ continues to hold above the 604 to 598 band, the path of least resistance remains upward. A sustained rotation back into that pocket would be a normal retest. Clean failure through it would materially alter the trend structure.
IWM
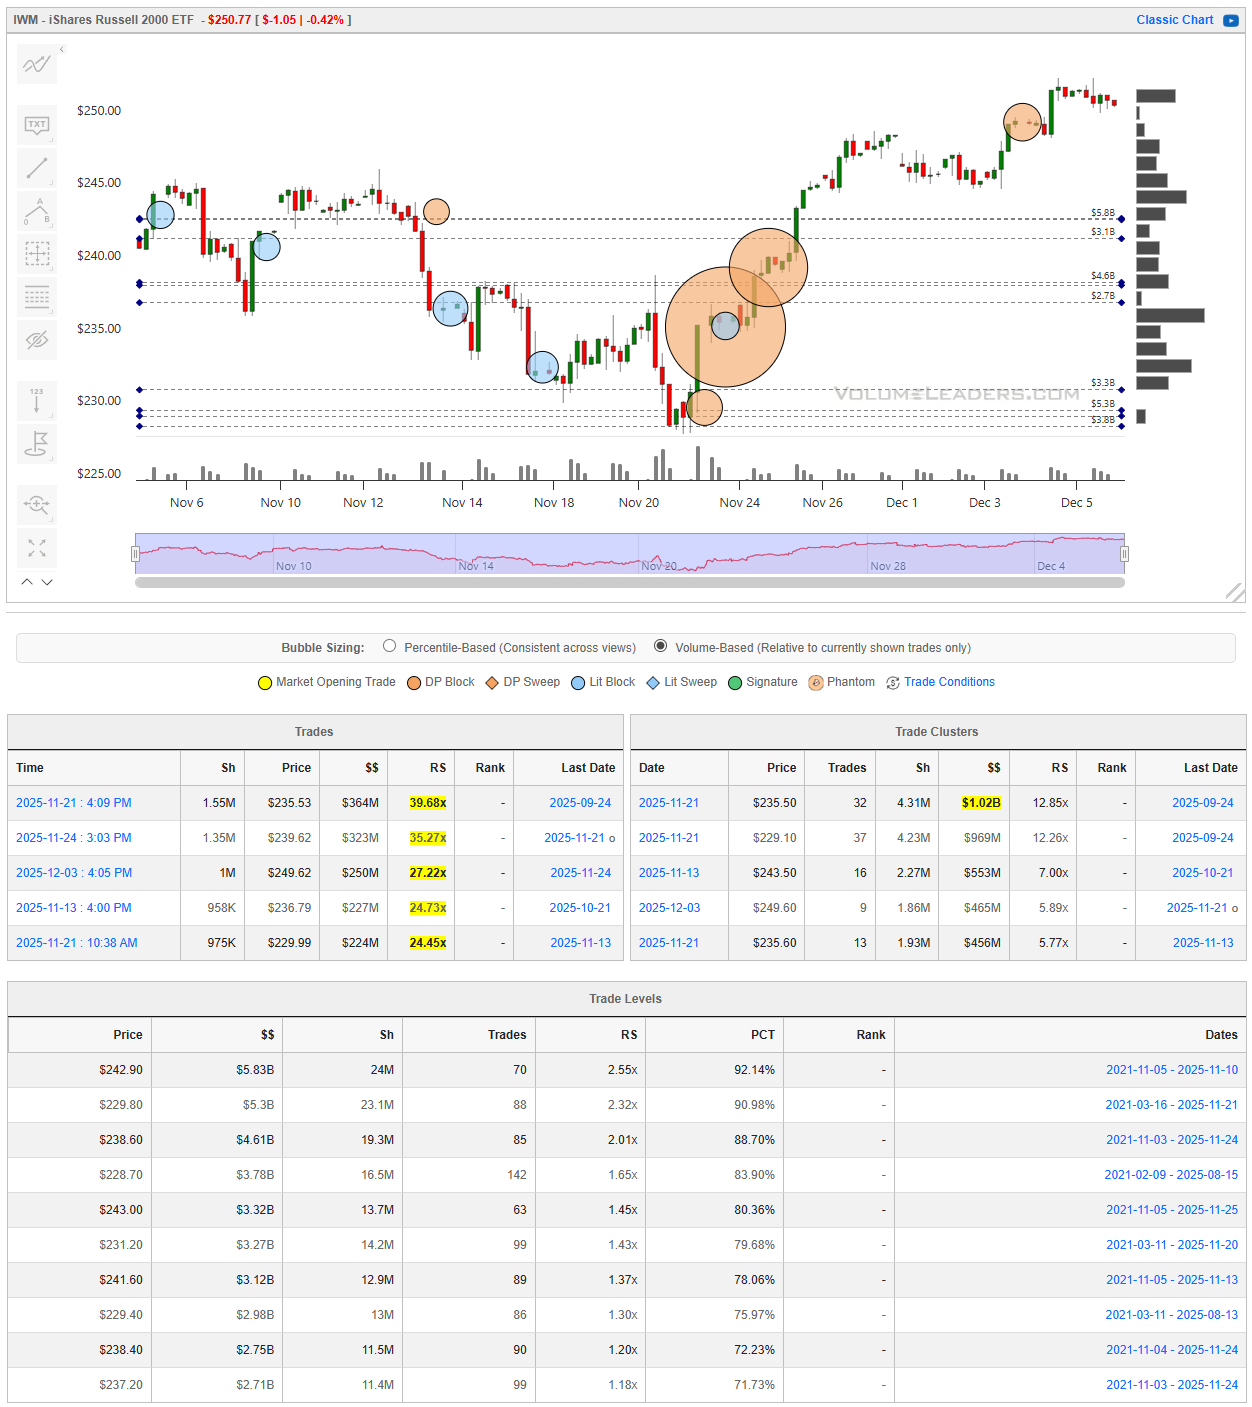
IWM delivered the most violent pendulum swing of the group. After a cascading drop into the high 220s, price encountered overwhelming demand between 229 and 235, where the single largest time-bound cluster printed near 235.50 with over $1B in notional and a relative size close to 13x. Additional accumulation followed at 229.10 and again near 243.50 as the recovery matured. The volume-defined levels confirm that the true center of gravity is higher, with the richest shelves clustered around 242.90 and 229.80, each carrying multi-billion dollar turnover with RS north of 2x and high percentile ranks. The rebound that carried IWM back toward the 250 region unfolded in textbook staircase fashion, with each pullback shallow and quickly bought. The key pass-fail for the next phase sits at the 242 to 238 band. Acceptance above it keeps the uptrend intact and targets the recent highs. Failure through it would likely invite a deeper inventory correction back toward the high 220s demand pocket.
DIA
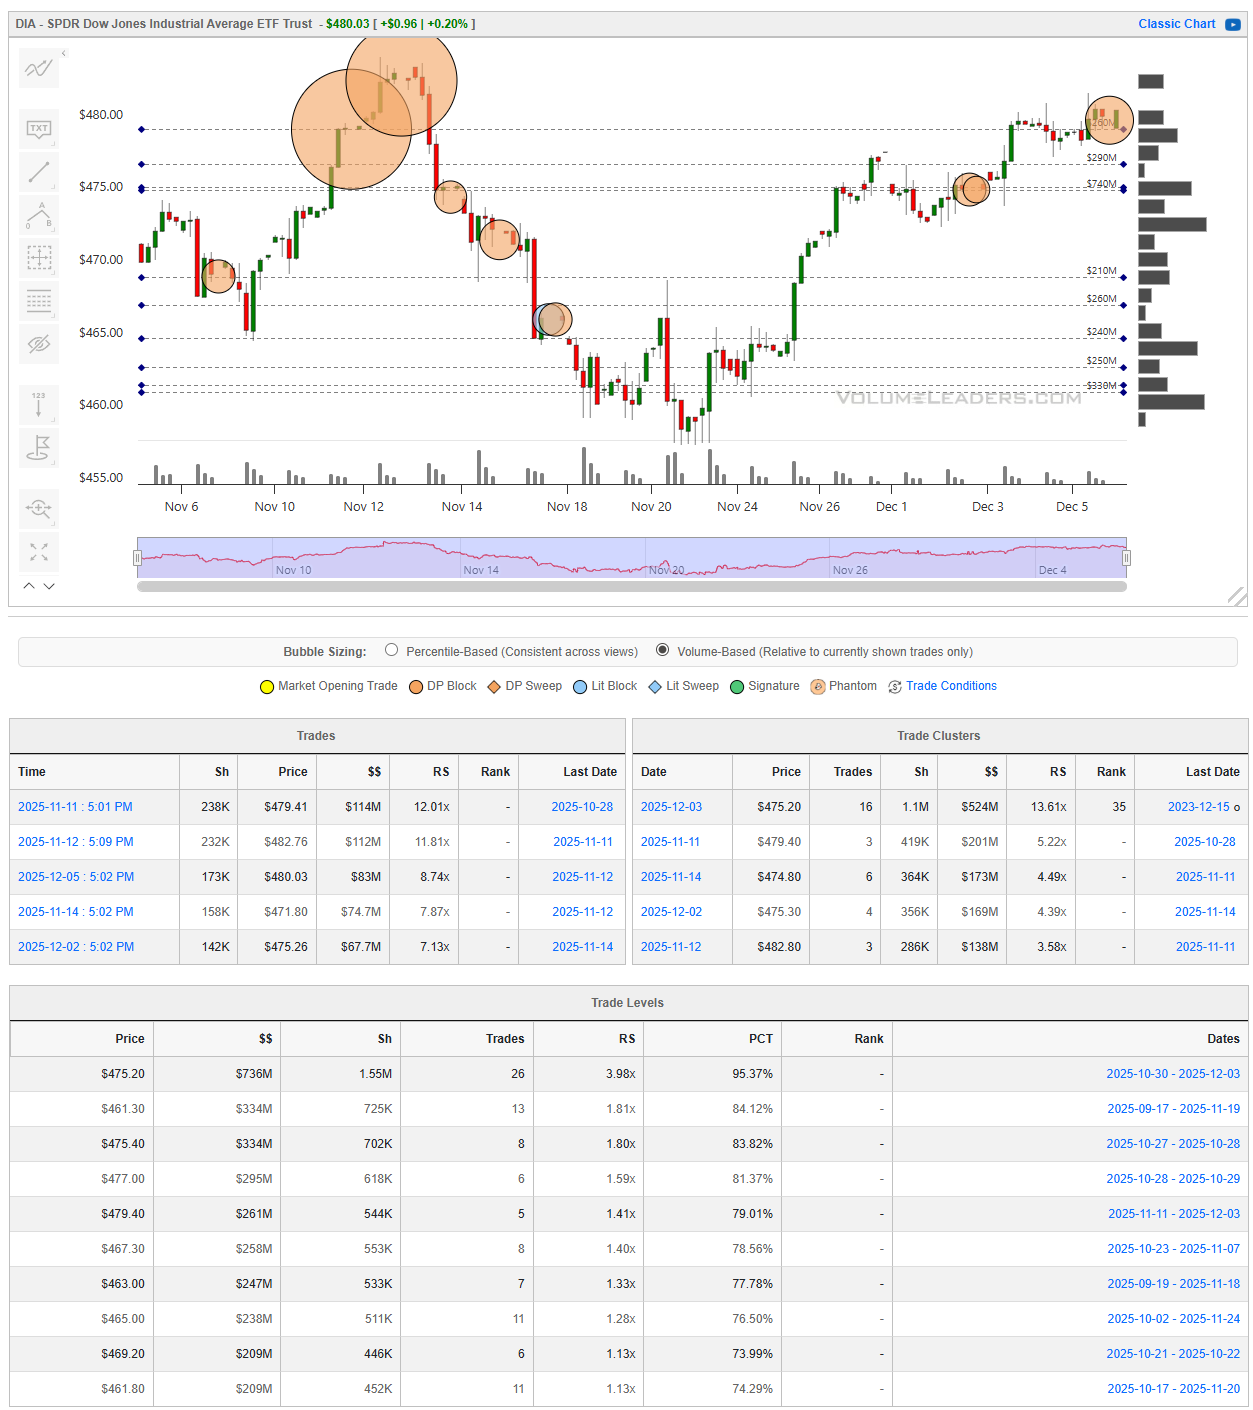
DIA has traced the cleanest mean-reversion arc of the four. Heavy supply was registered near the 479 to 482 zone early in the window, with multiple orange-type prints clustered in that area. The ensuing selloff found responsive demand just above 460, where price stabilized before beginning a measured recovery. The most important recent cluster sits at 475.20 with just over $500M in notional and a relative size around 13x, now functioning as the primary pivot. Adjacent shelves at 474.80 and 475.30 reinforce this mid-470s magnet. Long-term volume levels also emphasize the importance of this region, with the 475 and 461 bands showing the highest cumulative turnover in the profile. As long as DIA holds above 475 on a closing basis, the tape remains in balance-to-uptrend mode with scope to re-engage the upper 480s. A loss of 475 would expose the lower 460s shelf and shift posture back to defensive.
From an execution standpoint, the common thread across all four is that initiative risk is asymmetrically poor up here, while responsive risk is well-defined against clearly mapped shelves. Disciplined traders will likely frame participation through pullbacks into the highest-dollar nodes rather than chasing marginal highs. Continuation scenarios require acceptance above 685 in SPY, sustained trade above 623 in QQQ, holding 242 in IWM, and defending 475 in DIA. Bearish scenarios activate only on clean acceptance below 662 in SPY, below the 598 to 604 band in QQQ, below 238 in IWM, and under 461 in DIA, in each case pointing price toward the next major embedded volume pocket.
Bottom line: The tape remains constructive but increasingly inventory-heavy at the highs, with continuation dependent on holding above key shelves rather than expanding range
SPY: 685, 675-669, 662
QQQ: 623, 608-605, 598
IWM: 250, 242-238, 229
DIA: 480, 475, 461

Summary Of Thematic Performance YTD
VolumeLeaders.com offers a robust set of pre-built thematic filters, allowing you to instantly explore specific market segments. These performance snapshots are provided purely for context and inspiration—think about zeroing in on the leaders and laggards within the strongest and weakest sectors, for example.
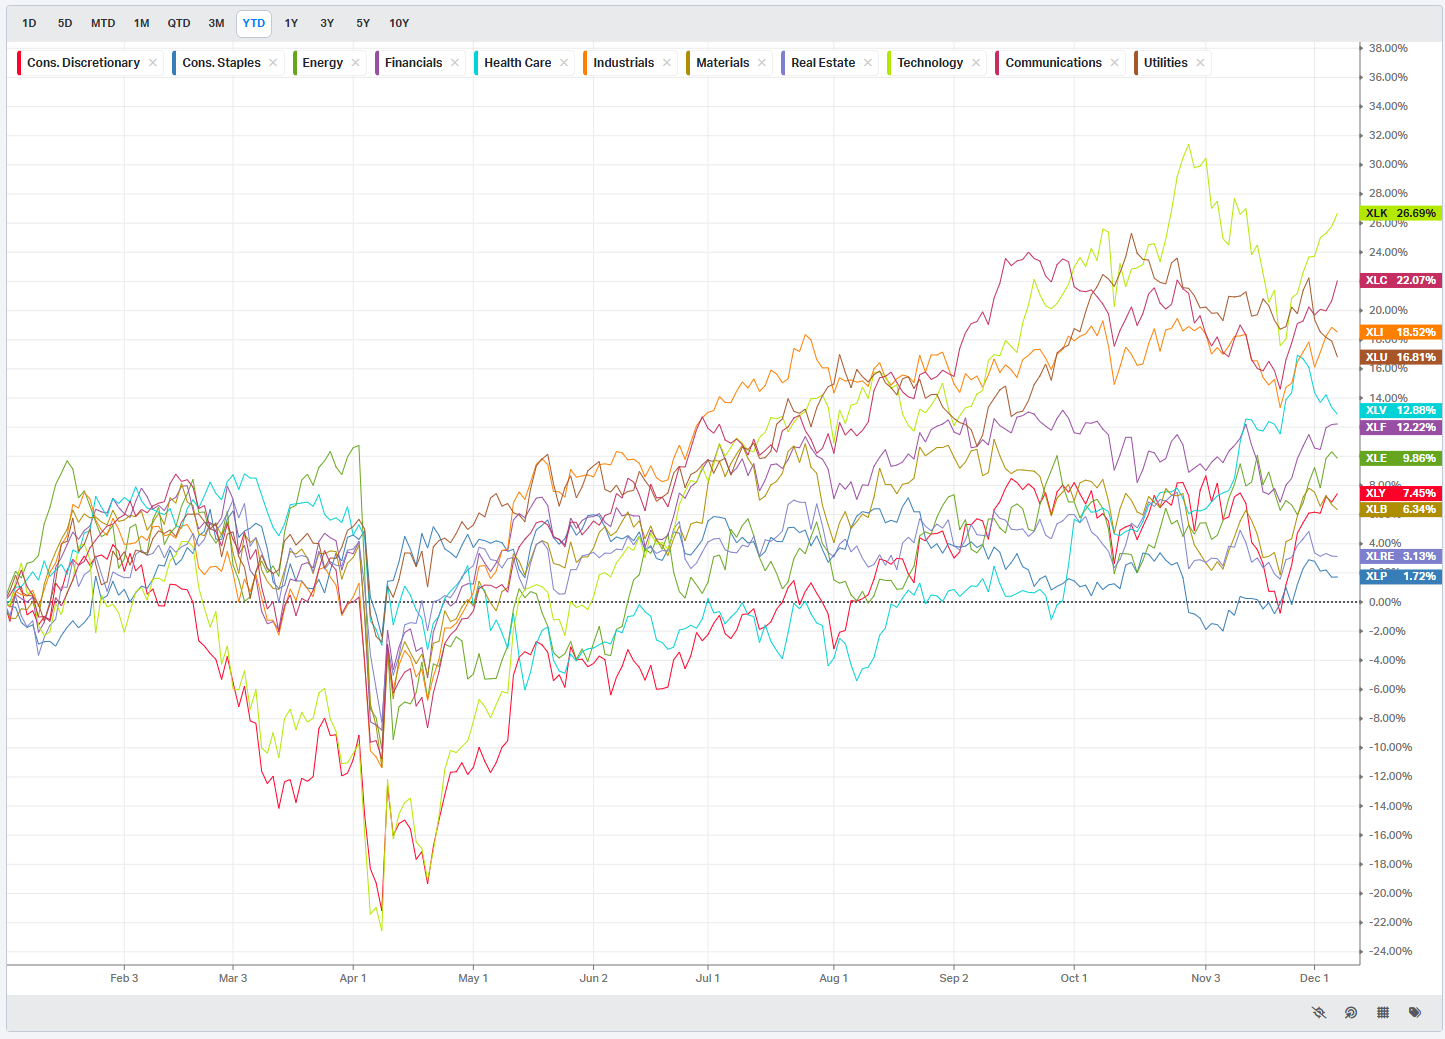
S&P By Sector
S&P By Industry
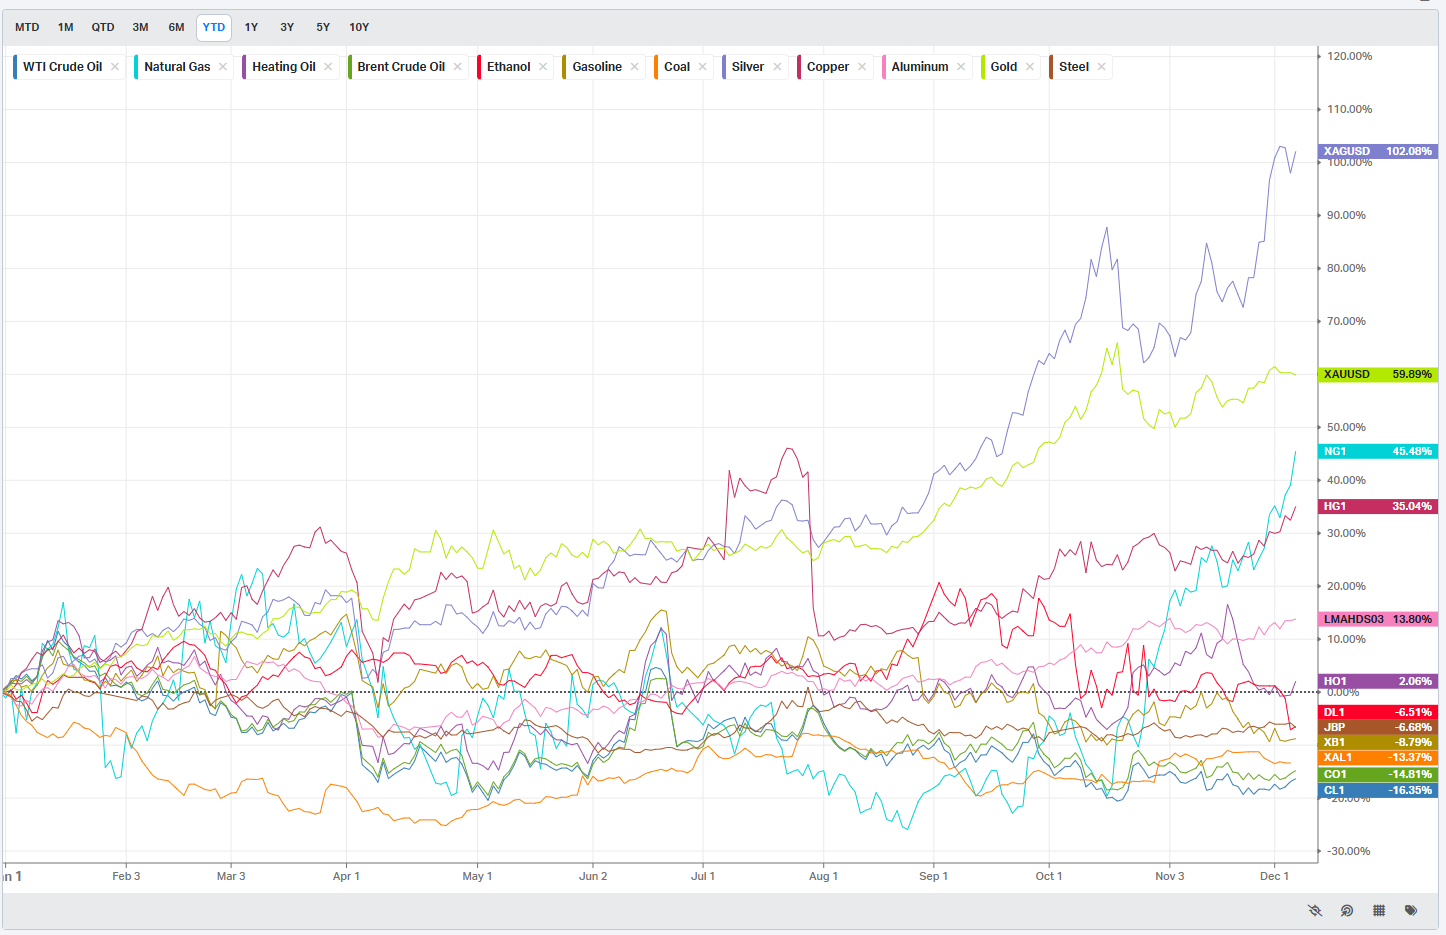
Commodities: Energy & Metals
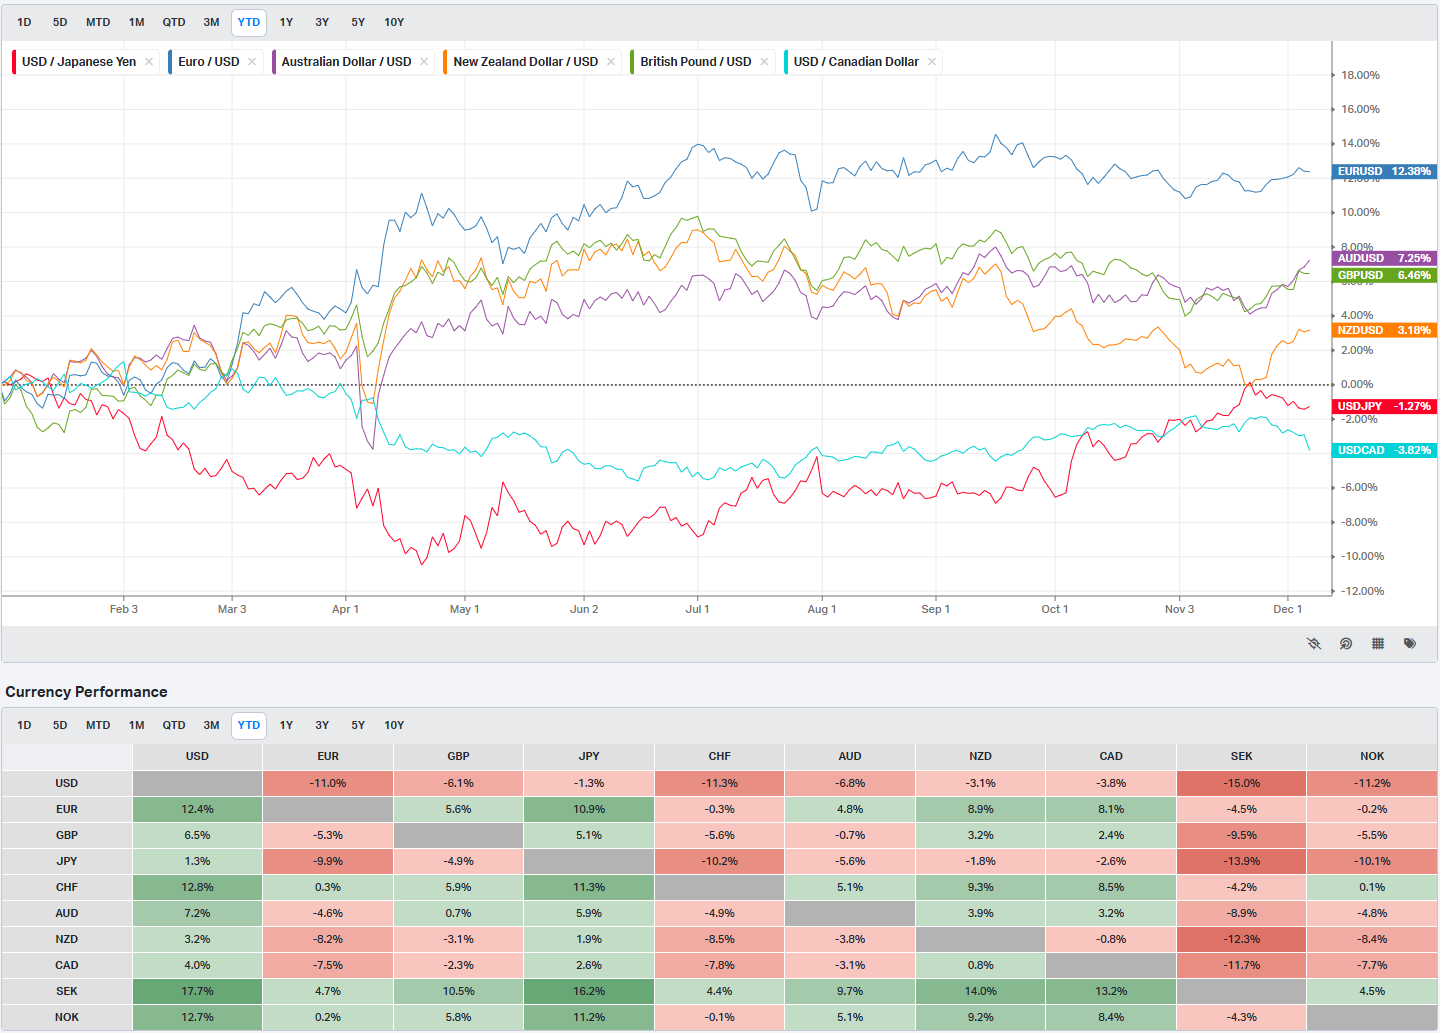
Currencies/Major FX Crosses
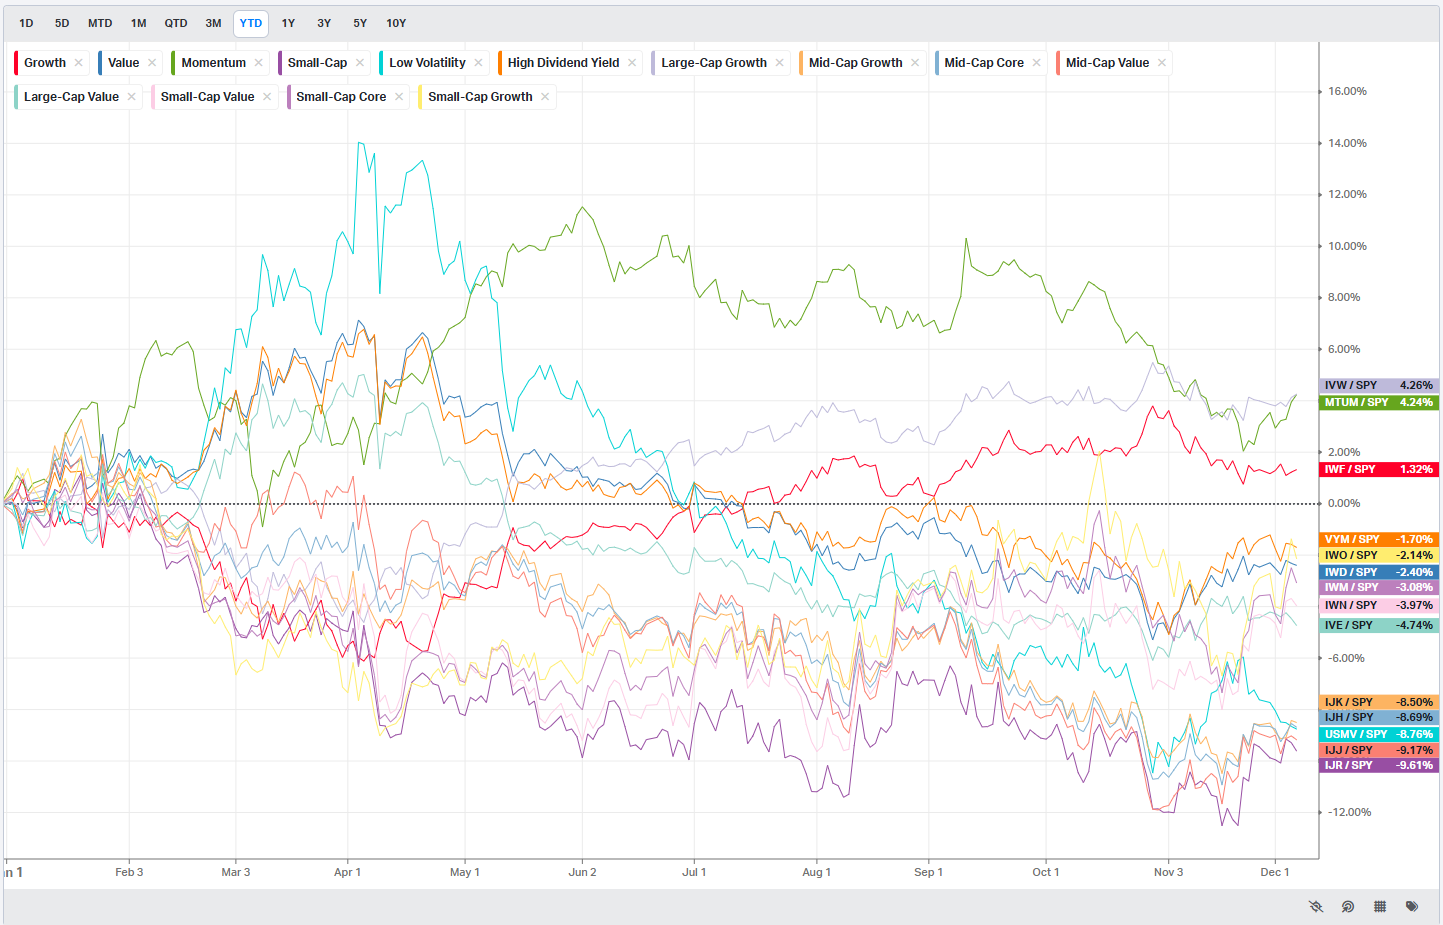
Factors: Style vs Size-vs-Value

Events On Deck This Week
Here are key events happening this week that have the potential to cause outsized moves in the market or heightened short-term volatility.
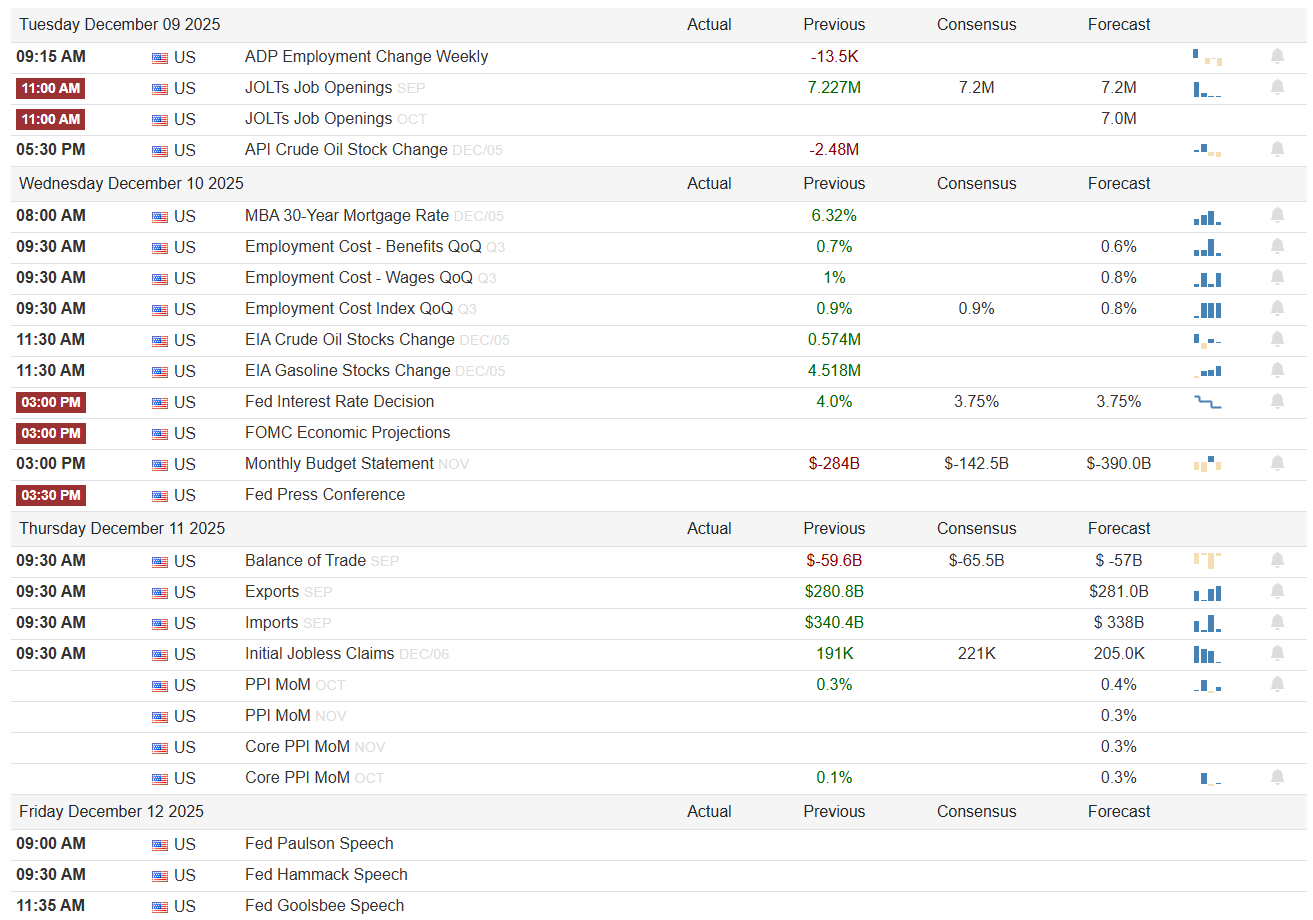
Monday opens as a calm staging area. With no major data or earnings on deck, price action will be dominated by position squaring ahead of a dense mid-week macro cluster. After the recent run, the absence of catalysts makes Monday more about how traders want to be positioned into the Fed and inflation prints than about new information. If we see equities bid with vol offered into the close, it will tell you the street is leaning toward a benign policy message and contained inflation; a defensive drift with higher rates into Tuesday would argue the opposite.
Tuesday starts the real work with labor and energy. The ADP Employment Change Weekly series prints against a previous reading of -13.5K, so the bar is low: anything that swings back into clear positive territory would reinforce the soft-landing narrative, while another negative print would reopen questions about momentum in private hiring. JOLTs job openings for September and October cluster around the 7.2M mark, with the September previous at 7.227M and both consensus and forecast for September at 7.2M and October at 7.0M. A sustained slide toward that 7.0M handle would signal cooling labor demand in line with the Fed’s goals, which the equity market should interpret as risk-on as long as the decline is orderly. A surprise rebound in openings back well above the prior 7.227M would argue that labor tightness is not easing and could put upward pressure on yields. Late in the day, the API crude oil stock change (previous -2.48M) will color the energy tape: another draw would keep a bid under crude and energy equities, while a surprise build would lean risk-off for that sector but supportive for the disinflation camp.
Wednesday is the fulcrum. The housing side checks in at 8:00 AM with the MBA 30-year mortgage rate, coming off a previous 6.32 percent. A move lower would confirm that financial conditions are easing at the margin, which equities typically welcome, while a renewed push higher would warn that mortgage pain has not fully abated. At 9:30 AM, the labor cost complex hits in force. Benefits costs ran 0.7 percent QoQ in Q3 with consensus now at 0.6 percent; wages posted 1.0 percent in Q3 with consensus and forecast both at 0.8 percent; the overall employment cost index printed 0.9 percent with consensus holding at 0.9 percent and forecast shading down to 0.8 percent. The market wants to see this entire block cool modestly toward those 0.6 to 0.8 bands. Any upside surprise back above the previous 1.0 percent in wages or 0.9 percent on the composite will be read as sticky labor inflation and will bias the session risk-off via higher yields. Energy traders get another look at supply with EIA crude stocks (previous 0.574M) and gasoline stocks (previous 4.518M), where persistent builds would help the disinflation story.
At 3:00 PM, the Fed takes center stage. The policy rate sits at 4.0 percent, with both consensus and forecast for the new decision at 3.75 percent, implying a quarter-point cut. A clean cut to 3.75 percent paired with projections that keep growth steady and core inflation gliding lower would be the textbook risk-on outcome. A hold at 4.0 percent or a hawkish set of projections that downplay future cuts would be risk-off and likely steepen the front end of the curve. Simultaneously, the Monthly Budget Statement for November hits, with a previous deficit of -$284B, a consensus of -$142.5B, and a much wider forecast of -$390.0B. A number closer to the narrower consensus would damp fiscal-dominance fears, while a figure nearer -$390B would reinforce the idea that Treasury supply remains a persistent macro overhang. The 3:30 PM press conference is where nuance will matter most: language that emphasizes “data-dependence” and acknowledges cooling labor costs without celebrating victory would keep risk appetite intact; heavy focus on upside inflation risks would not.
Thursday is about external balances, the labor front door, and producer prices. The September trade balance previously printed -$59.6B, with consensus at -$65.5B and forecast at -$57B. A modest narrowing toward -$57B, paired with exports edging above the prior $280.8B toward the $281.0B forecast and imports easing from $340.4B toward $338B, would tell a story of resilient external demand and slightly softer domestic appetite, a configuration that markets can live with. A sharp widening of the deficit toward or beyond -$65.5B would lean risk-off via growth concerns or a stronger import bill. Initial jobless claims, previously 191K with consensus at 221K and forecast 205K, are the next pivot. A gentle drift up into the low 200Ks keeps the soft-landing script intact; a break back below 190K would suggest re-tightening labor conditions, while a spike above the 221K consensus would flag emerging labor stress.
Producer prices then anchor the inflation side. October PPI MoM sat at 0.3 percent with consensus looking for 0.4 percent; November PPI has both consensus and forecast at 0.3 percent, and core PPI MoM consensus stands at 0.3 percent as well against an October core of 0.1 percent. The ideal risk-on mix is a headline and core both landing at or a tick below 0.3 percent, confirming that pipeline price pressures remain contained. A double-print at 0.4 percent or higher would undo some of the goodwill from any dovish Fed language and could quickly re-steepen yields.
Friday wraps with three Fed voices: Paulson at 9:00 AM, Hammack at 9:30 AM, and Goolsbee at 11:35 AM. With the decision and projections already out, the market will parse their remarks for alignment. If all three lean into the idea that the cut path is conditional and that the bar for re-tightening is high, that will anchor a risk-on bias. Any coordinated attempt to walk back perceived dovishness from Wednesday would be risk-off, especially if it comes on the heels of hotter-than-expected PPI.
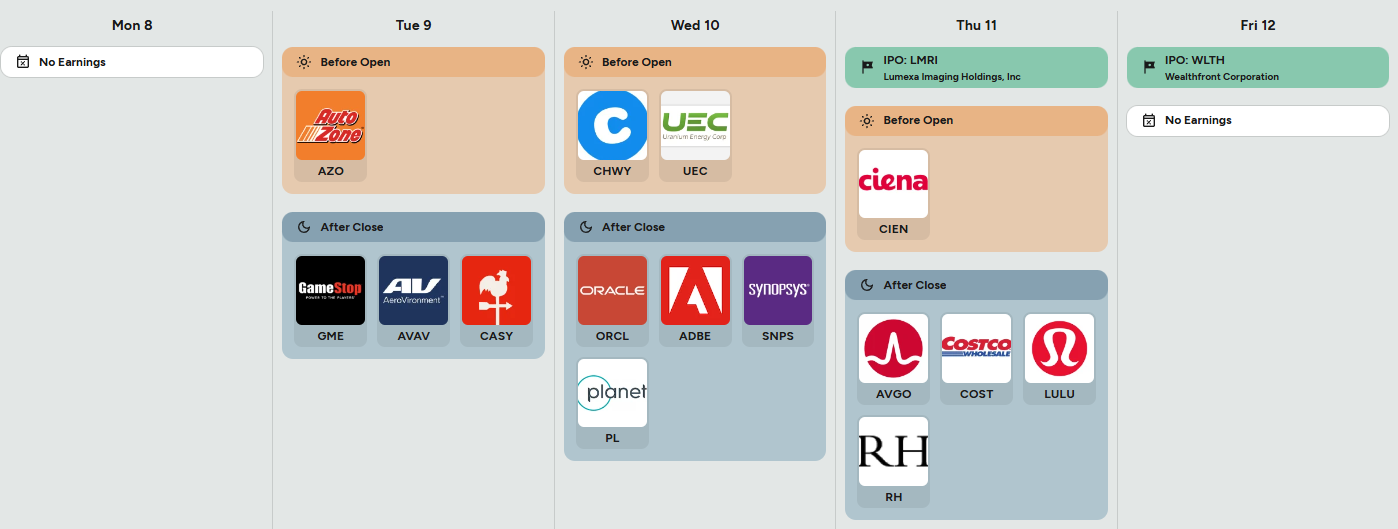
On the micro side, the earnings and IPO slate adds important color. AutoZone on Tuesday morning gives a clean read on the health of the do-it-yourself consumer and auto parts ecosystem; watch same-store sales and gross margin for clues on price sensitivity. GameStop, AeroVironment, and Casey’s after the close will shape sentiment in specialty retail and defense; traders will focus on revenue growth trajectories and any commentary on consumer traffic. Wednesday is the big tech night: Oracle, Adobe, and Synopsys, along with Planet Labs, all speak to enterprise software spend, design automation demand, and the broader AI and cloud capex cycle. Strong bookings and forward guidance here would be a tailwind for the entire tech complex. Thursday brings Ciena in the morning on optical and networking demand, then Broadcom, Costco, Lululemon, and RH after the close. Broadcom’s commentary on semis and custom AI silicon will ripple through the chip space, while Costco, LULU, and RH together offer a high-quality cross-section of consumer staples, premium apparel, and high-end home spending. The two IPOs, Lumexa Imaging Holdings (LMRI) on Thursday and Wealthfront Corporation (WLTH) on Friday, will act as live gauges of risk appetite in primary markets; healthy debuts would confirm that the window for new issuance is open again.
Sign-posts for active traders:
Fed decision and dot-plot tone relative to the 3.75% rate consensus on Wednesday at 3:00 PM.
Thursday’s Initial Jobless Claims versus the 221K consensus and PPI MoM versus the 0.3% expectations.
Broadcom, Costco, and Lululemon reactions Thursday after the close as real-time checks on tech, staples, and discretionary leadership.
Bottom line: this is a Fed-and-inflation dominated week where modestly cooler labor costs, contained PPI, and steady consumer earnings would extend the risk-on narrative, while any combination of hot wages, firm producer prices, or hawkish Fed rhetoric could quickly put the brakes on the current rally.
Order Flow in Focus: Reading Smart Money Tells
Order Flow in Focus: Reading Smart Money Tells is a recurring segment that spotlights unique intraday opportunities revealed through institutional order flow. Each feature dissects a moment when the tape quietly shifted—when large, ranked prints clustered at key liquidity locations and informed players positioned ahead of the move. The goal isn’t hindsight; it’s pattern recognition—learning to spot the footprints of capital that knows before the crowd does.
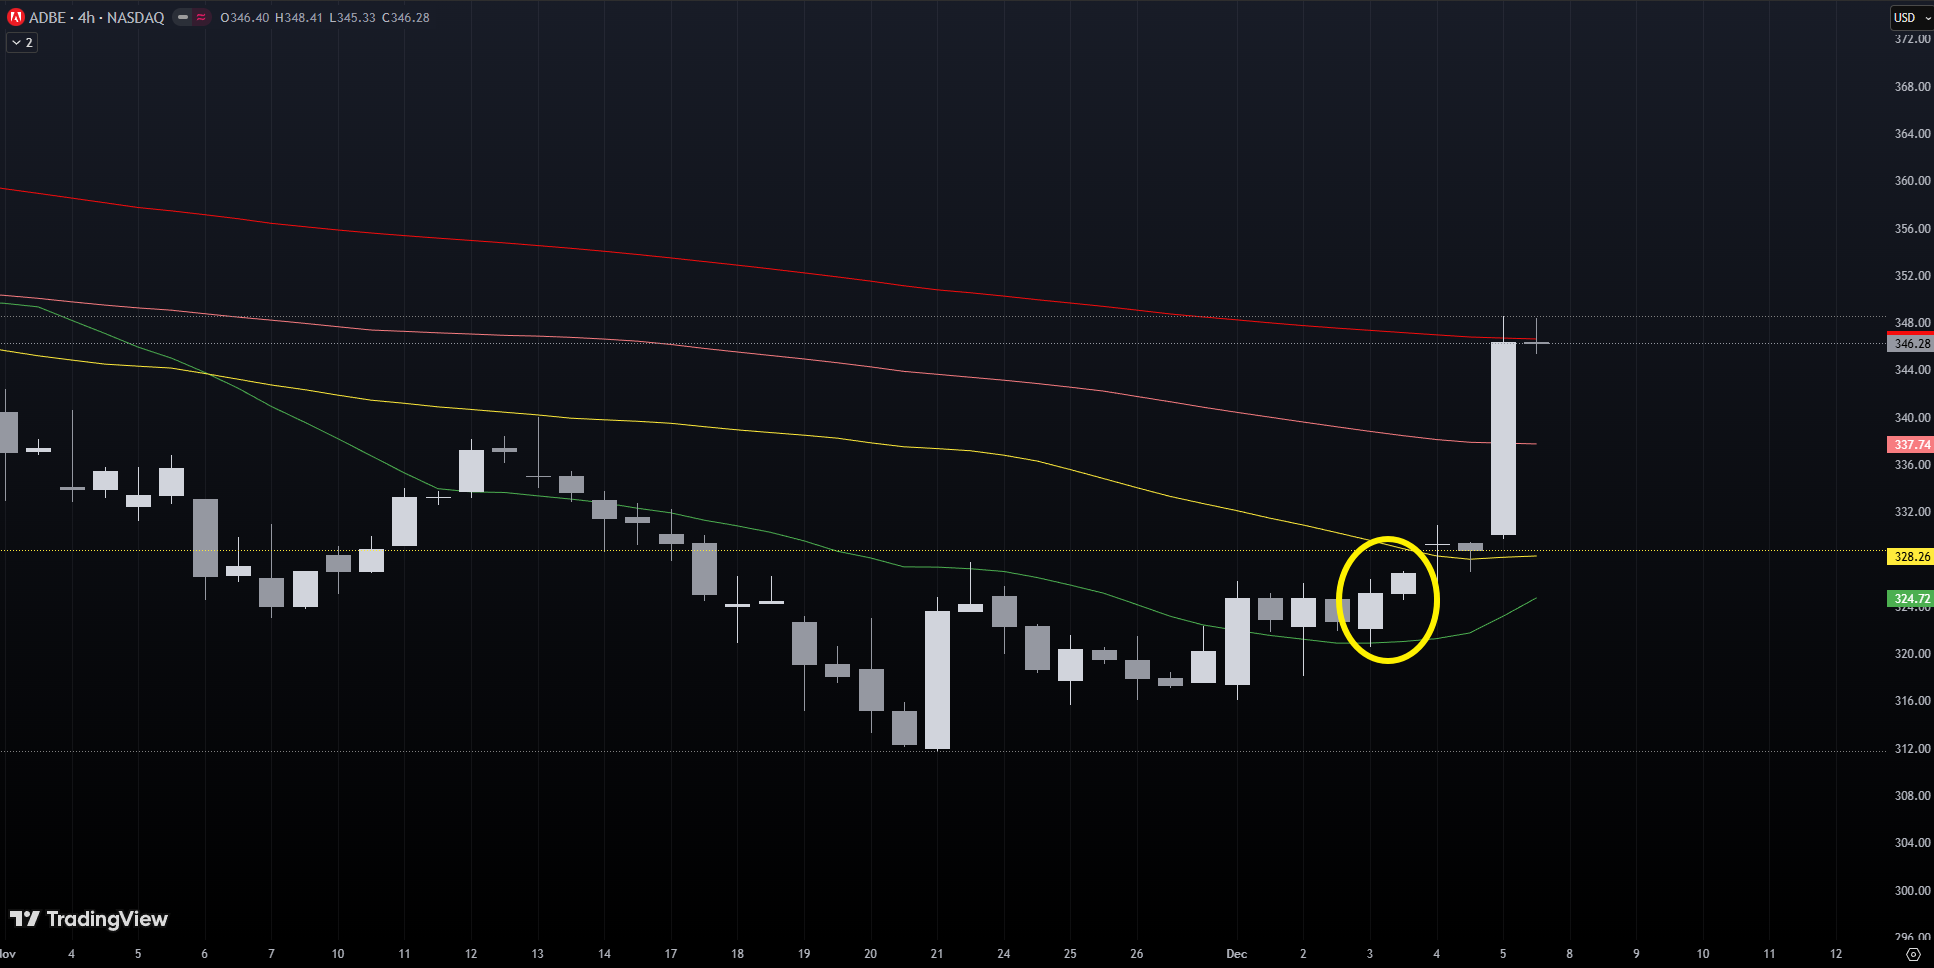
ADBG as a Tactical Proxy for an Adobe Breakout
This was not an ADBG trade in spirit. It was an Adobe trade, quietly telegraphed through leverage. The tell came at the exact moment most traders were still debating whether ADBE’s bounce off the lows was real or just another reflex rally. As Adobe reclaimed its 20-day moving average, the largest print on the ADBG tape fired at the single highest-volume traded level in the entire visible profile. That combination matters. A ranked number one print is already rare. A number one print at the number one traded level, timed precisely with ADBE regaining its short-term trend, is not coincidence. That is institutional intent expressed through a tactical instrument designed for speed and convexity.
Price behavior around that event carried all the context a disciplined tape reader needs. ADBG had just completed a controlled descent into the 8.75 region after weeks of orderly liquidation from the 9.75 supply band. There was no panic at the lows, only compression. When the largest print struck inside that compression, it was not a reaction to momentum. It was a proactive position. More importantly, that print arrived as ADBE itself was reclaiming its 20DMA, the first structural shift from repair to potential trend resumption. Institutions were not buying the breakout in Adobe. They were positioning for it, using a leveraged proxy to maximize delta ahead of public confirmation.
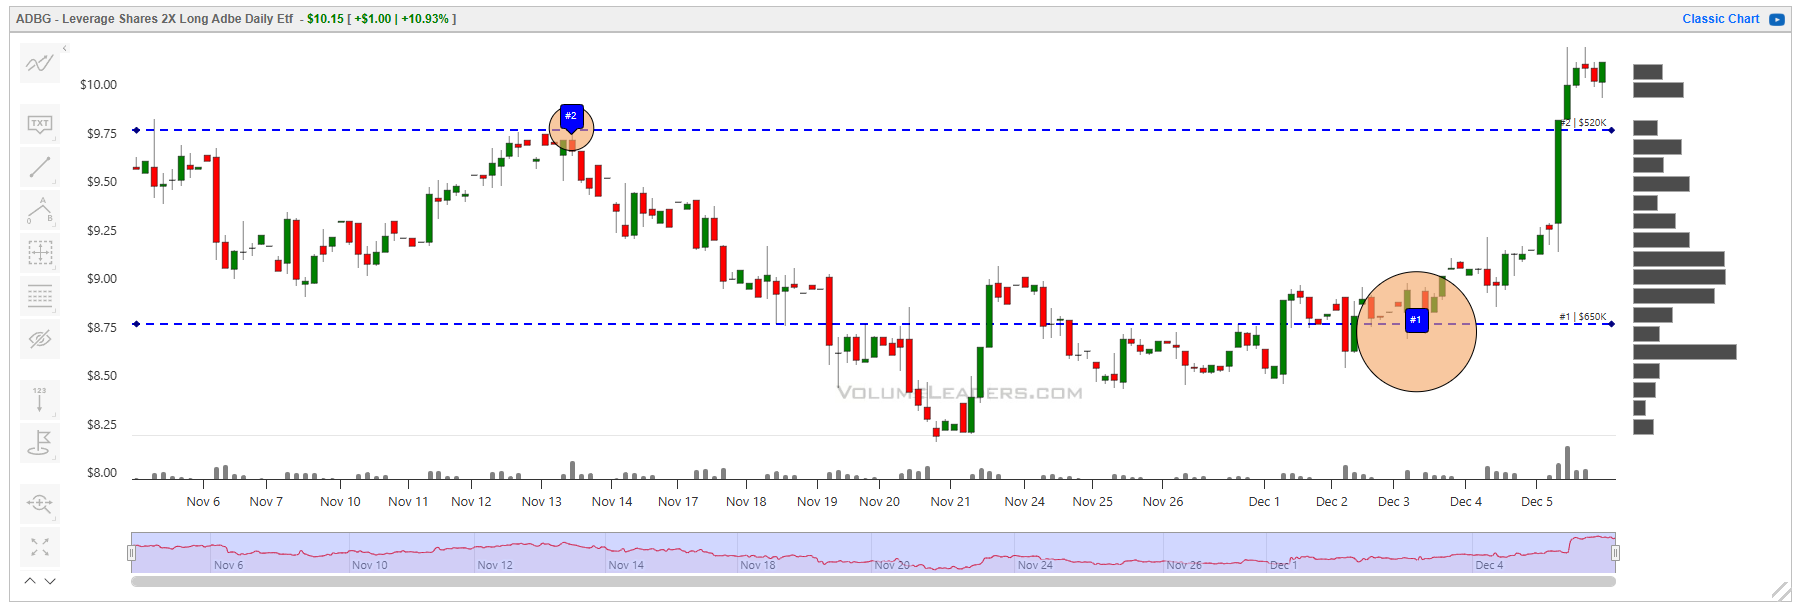
Once that 8.75 zone held after the print, the trade framed itself. ADBG rotated higher through 8.90 and 9.00 without resistance, signaling that the inventory transfer at the lows was complete. At that stage, the thesis was no longer about ADBG. It was about riding Adobe’s reacceleration phase with an instrument that would magnify the underlying move. As ADBE continued to firm above its 20DMA, ADBG entered expansion mode, driving straight back toward the prior 9.75 supply band that had rejected price weeks earlier.
That prior rejection zone became the decision point. When ADBG approached 9.75 this time, it did not hesitate. The earlier overhead supply had already been absorbed during the accumulation phase. Price punched through 9.75 in one clean campaign and extended into the low 10s. From the moment of that initial #1 print to the eventual peak, the underlying Adobe move translated into a 7+ percent upside rip in ADBE itself. That alone was a complete trade by any reasonable standard.
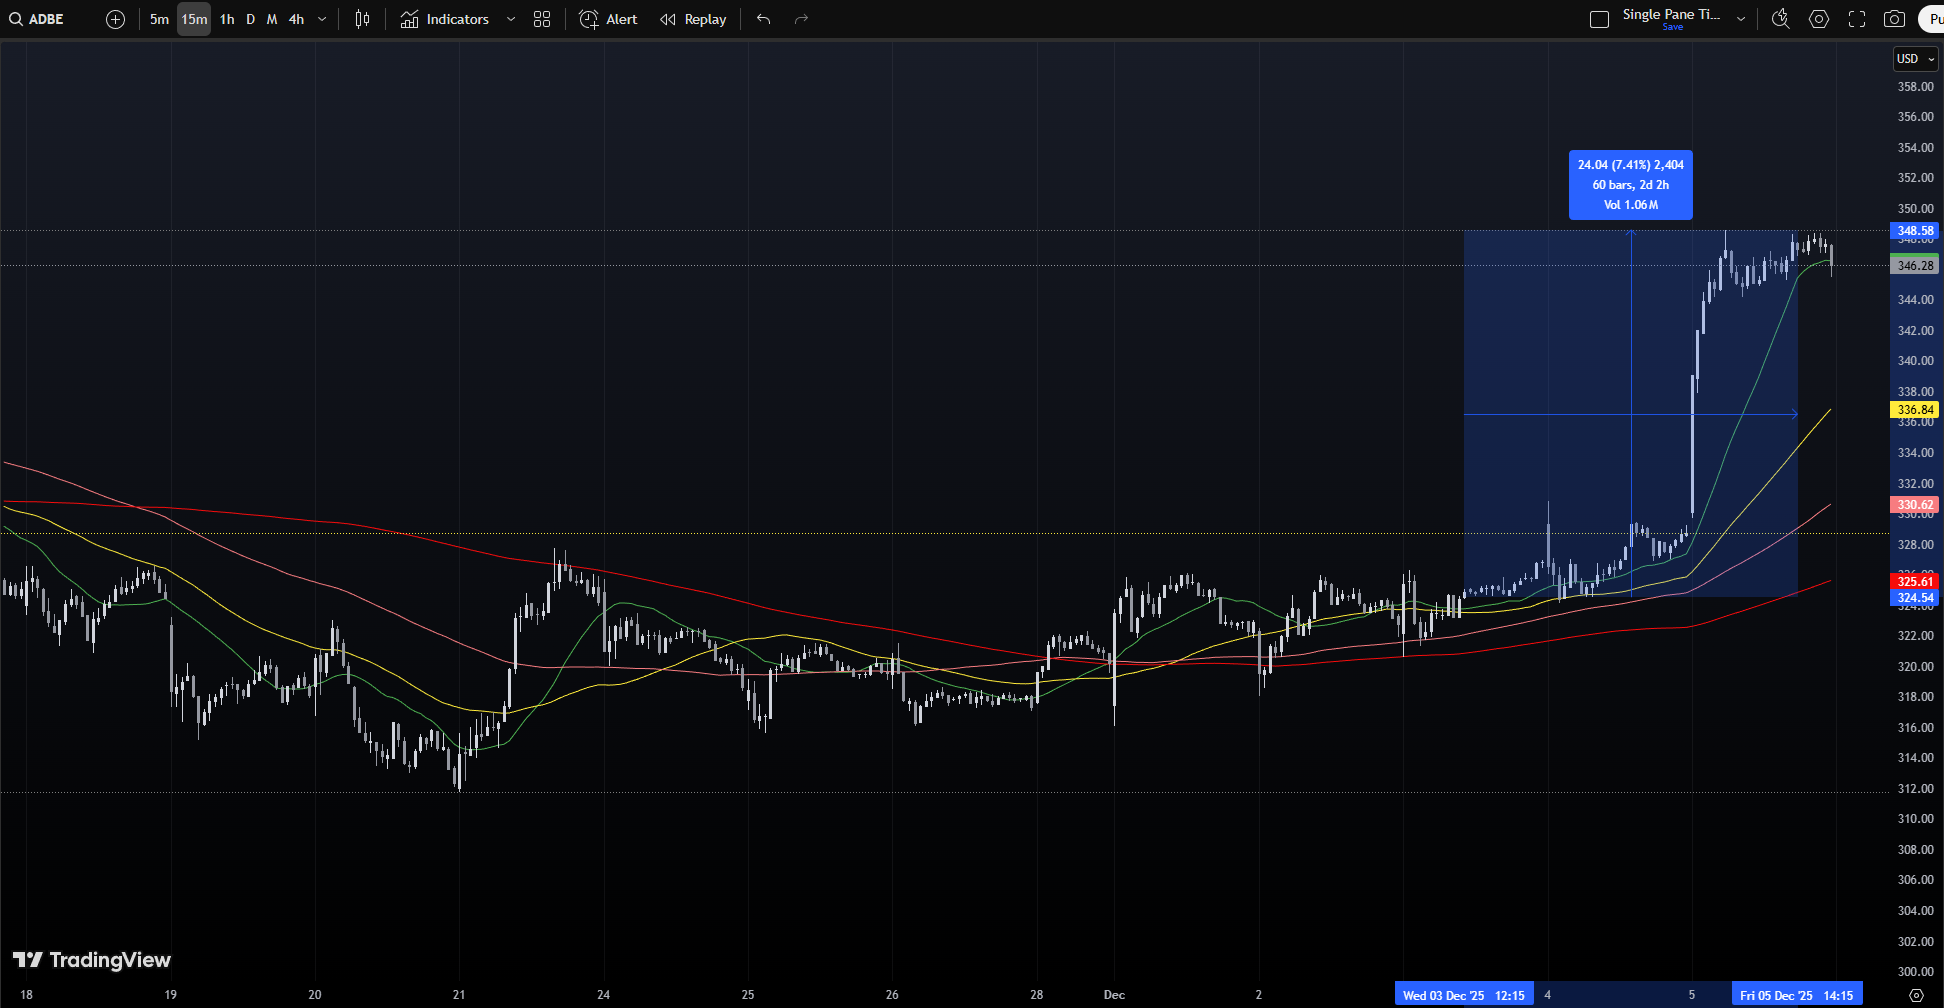
But the tape added one final gift. That 7+ percent advance in Adobe carried price directly into its 200-day moving average. The 200DMA is not a retail curiosity. It is a long-duration institutional reference point for trend classification and risk budgeting. When price tags it after a fast recovery leg, that is exactly where systematic sellers, hedgers, and longer-horizon rebalancers tend to reassert themselves. It is not the place to press new longs. It is the place to harvest exposure.
From a trade management standpoint, the full cycle could be executed with clean logic from start to finish. Entry was justified when the #1 ADBG print struck the #1 volume level as ADBE reclaimed its 20DMA. Risk was defined beneath the 8.75 ADBG shelf, which never failed. Confirmation arrived as ADBG cleared 9.00 and began trending. Partial exits were justified into the 9.75 to 10.00 zone as the prior supply area was tested. Final trims were fully validated as ADBE tagged its 200DMA following the 6.66 percent advance.
What made this setup exceptional was not the magnitude of the move. It was the precision of the signal. Institutions did not need Adobe to be in a confirmed uptrend to act. They needed it back above short-term trend with enough liquidity to size into the position without moving price. They expressed that view not through the underlying stock, but through a leveraged wrapper that allowed them to capture concentrated exposure during the highest convexity phase of the recovery.
For traders studying this tape, the lesson is not about chasing leverage. It is about recognizing when leverage is being used as a forward-looking instrument by informed capital. When the largest position of the entire window appears at the exact moment a major stock reclaims a key moving average, at the most heavily trafficked price level on the chart, the market is offering a headline in size rather than in words.
Bottom line: Institutions tipped their hand in ADBG exactly as ADBE reclaimed its 20DMA, rode a clean 7+ percent advance into the 200DMA, and left a textbook example of how leveraged ETFs can quietly reveal high-conviction directional intent.

Market Intelligence Report
A desk-grade synthesis of institutional positioning and market structure—unpacking the flows, levels, and emerging themes that shaped the week, and translating them into a model portfolio built the same way professional desks prepare for the week ahead.
Weekly Portfolio Review
The portfolio we assembled for Thanksgiving week and let ride through this week was shaped by one simple premise: let large, persistent capital decide where risk should be taken, and structure exposure around those footprints. This was not a momentum chase. It was a bet on where institutions were already committed and where they were likely to defend. The results reflect exactly that dynamic, closing the week out at approximately 2.90%. Leadership came from selective technology and quality financials where order flow was strongest, while the hedging sleeve behaved as designed, cushioning, but at the cost of raw performance as equity beta expanded. Real assets delivered mixed but constructive participation. Core defensive anchors did what they were designed to do: steady, additive, not spectacular.
What worked was focus. What did not work was expecting inverse hedges to contribute in a week defined by persistent upside impulse. The tape was clear in hindsight, producing a spectacular recovery on the monthly. Money flowed into growth, financial intermediaries, and select infrastructure while protection bled out steadily. That is exactly what the weekly attribution confirms. Our last rebal:
Core Defensive Allocation — 35%
SCHD 10%
JEPI 10%
SPYD 7%
SPYM 5%
VOO / IVV 3%
Real Assets & Yield — 25%
EQR 5%
KIM 4%
HST 3%
VRE 3%
CURB 3%
SILA 2%
CNQ 2%
CVX 1%
AG 1%
DNOW 1%
Quality Financials — 15%
KEY 3%
BEN 3%
WAFD 2%
WBS 2%
BAM 3%
RITM 2%
Selective Tech Infrastructure — 15%
INFY 3%
WIT 3%
VRNT 2%
NXPI 2%
ZBRA 2%
GPN 2%
CORZ / REKR basket 3%
Hedges & Tactical Overlay — 10%
SQQQ 4%
PSQ 3%
NVDD 2%
SPSB or similar short-duration IG 1%Selective Tech Infrastructure was the engine room of the portfolio. Nearly half of the week’s net gains flowed from that sleeve alone. Quality Financials quietly compounded in the background with steady participation across regionals and asset managers. Core Defensive did its job of grinding higher without drama. Real Assets were mixed, held back by weakness in REIT-linked and specialized yield exposures. Hedges were the only structural drag, as expected in a constructive tape.
Top 5 Contributors to Portfolio Return
Ticker Contribution %
CORZ 0.48%
NXPI 0.37%
AG 0.34%
KEY 0.24%
REKR 0.24%
These five names alone explain the majority of the portfolio’s upside. Infrastructure and payments-related exposure led cleanly, with opportunistic metals participation providing a volatility kicker. The unifying theme across all five was persistent, ranked accumulation prior to expansion.
Top Negative Contributors
Ticker Contribution %
SQQQ -0.55%
VRE -0.16%
PSQ -0.14%
KIM -0.06%
SILA -0.04%
The hedging complex absorbed the cost of upside protection as risk appetite expanded. SQQQ and PSQ did exactly what inverse products are designed to do in a rising tape. The underperformance in VRE, KIM, and SILA reflects lingering real estate sensitivity and rate exposure. None of these losses were thesis-breaking; they were structural offsets.
This was a clean institutional tape week. Capital leaned into technology infrastructure, financial intermediaries, and selective cyclicals. NXPI and CORZ were emblematic of how persistent ranked accumulation tends to resolve: quiet positioning followed by air-pocket repricing. Quality Financials confirmed that rate volatility continues to benefit the intermediaries rather than penalize them. KEY, BEN, BAM, and WBS all showed steady participation rather than speculative chasing.
Core Defensive worked its role as ballast. JEPI, SCHD, SPYD, SPYM, VOO, and IVV provided steady, low-volatility contribution with no behavioral stress. That consistency matters when other sleeves are being asked to take directional risk.
Real Assets were conditionally supportive. AG delivered dominant performance as metals participation rotated back into the portfolio, but that strength was tempered by weakness in real estate-linked exposures. Energy was neutral to modestly positive, with CNQ and CVX acting more as stability than as leadership.
The only real drag came from the hedge sleeve. That is not a flaw. It is the cost of insurance in a market that chose expansion over contraction. If anything, the magnitude of SQQQ’s decline is itself confirmation of the underlying risk-on regime. Let’s take a look at what the tape is telling us this week.
MIR Part 1: The Backdrop
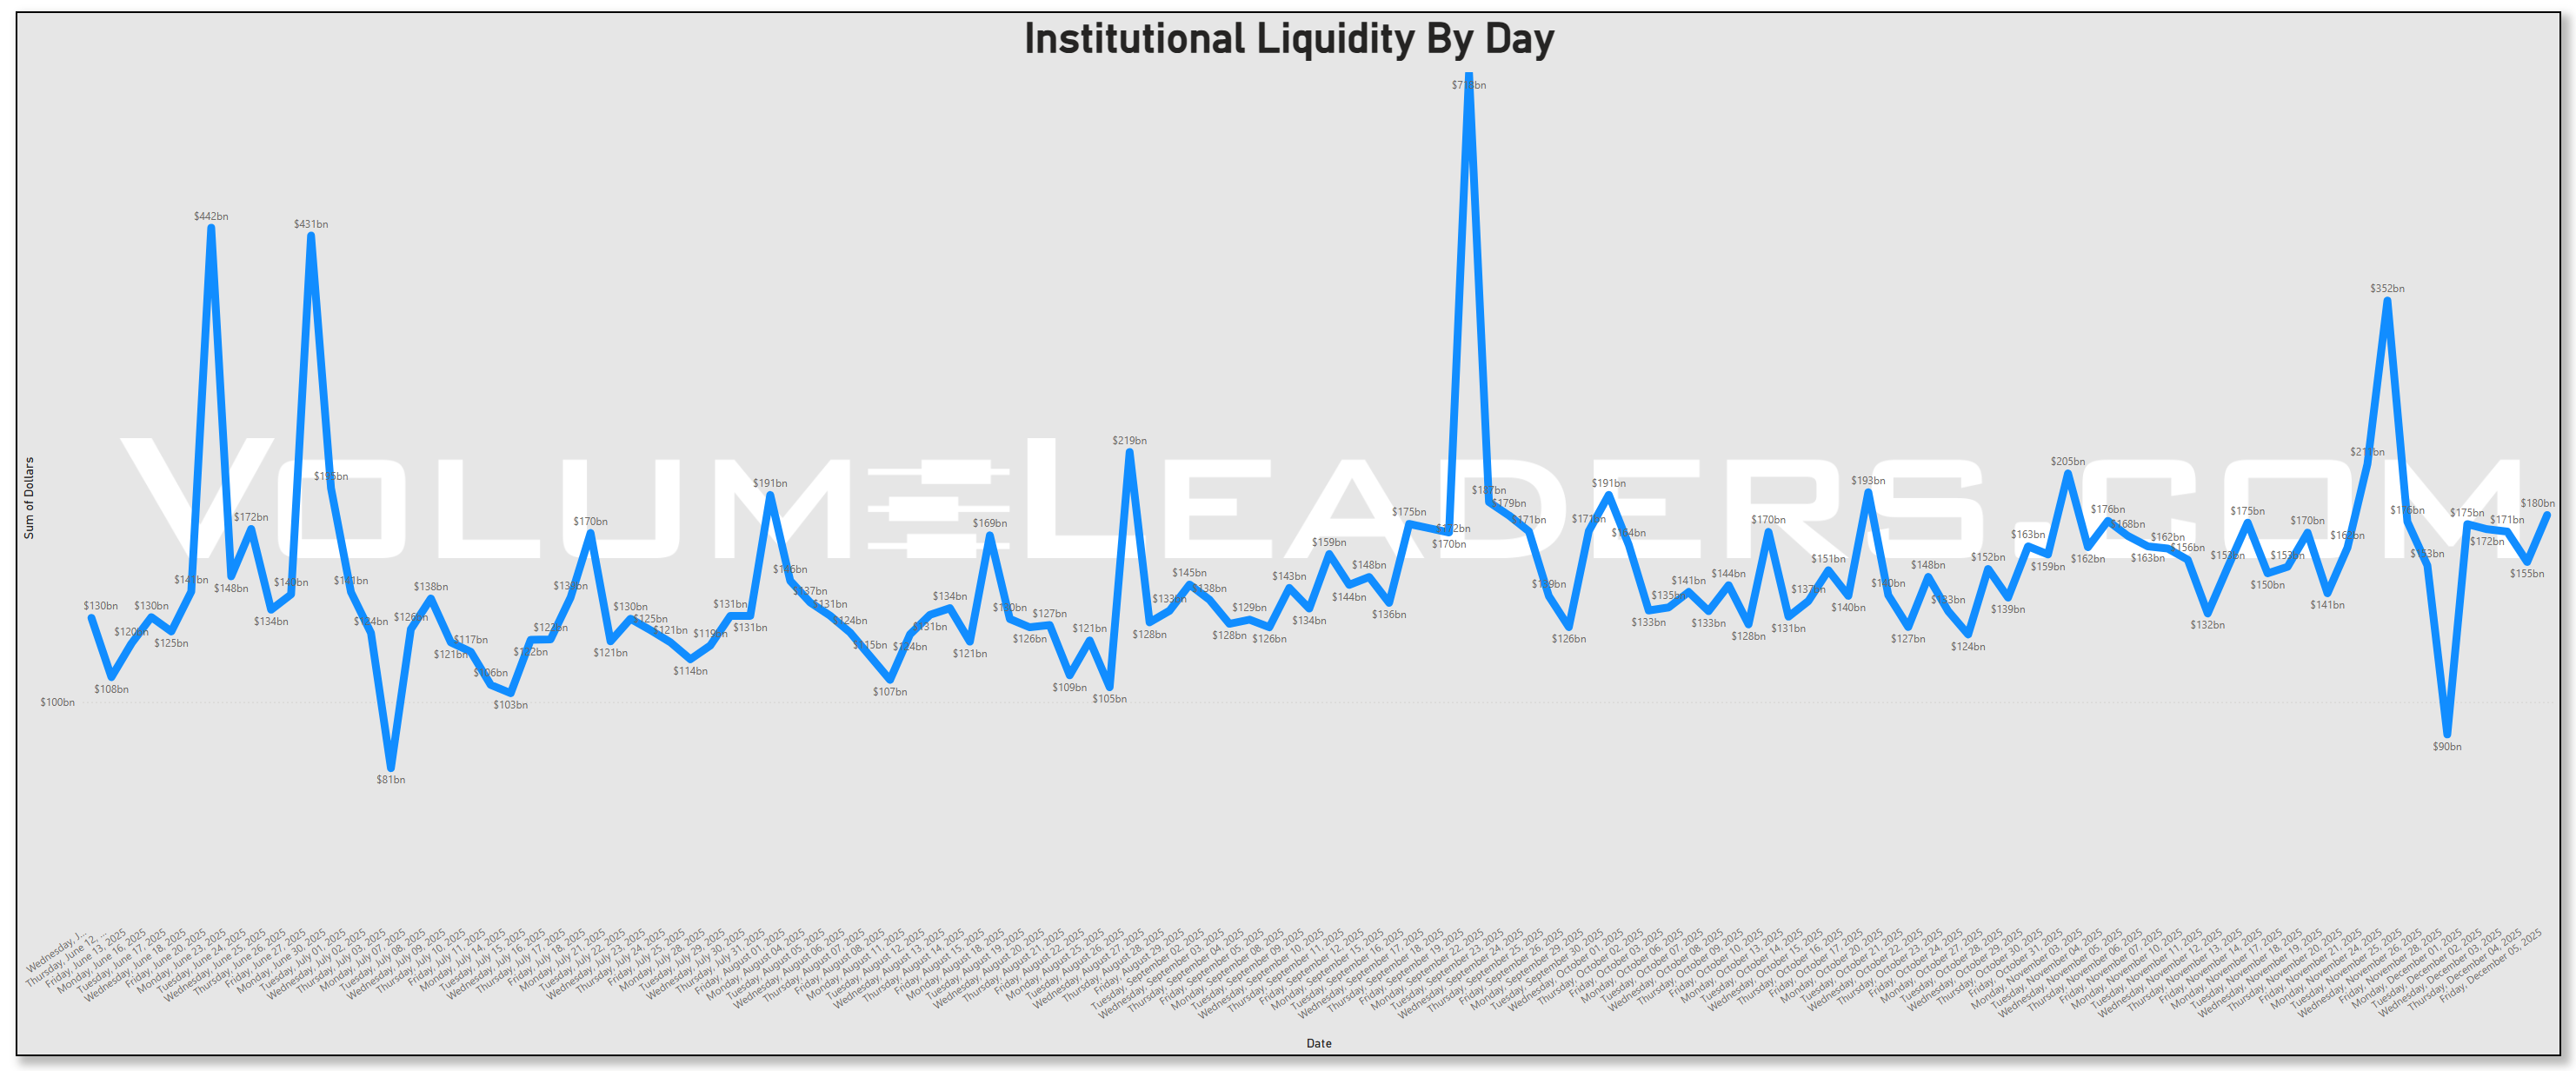
Liquidity first. Over the past couple of months the institutional tape has settled into a rhythm where “normal” sessions trade in the $120–$180bn range, punctuated by periodic blasts of liquidity around obvious event dates. The very large days tend to be structural rather than strongly directional: they are the days when mandates are forced to move. The most recent spike into -$350bn was the same as MSCI rebalanced several products.

Liquidity briefly collapsed into the ~$90bn neighborhood while markets digested both Thanksgiving and a stellar holiday-week-run-up to save the month before snapping back into the mid-$170bn area.
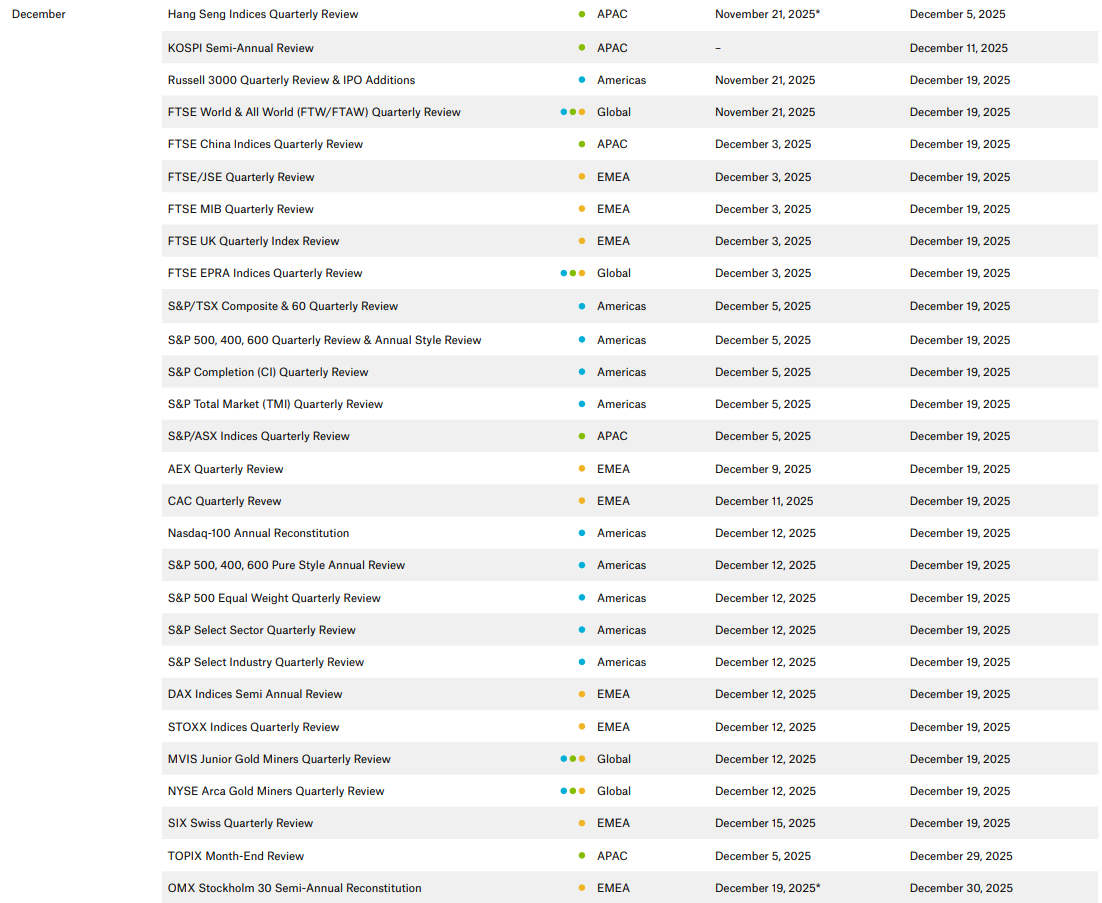
The daily sector dollars chart makes it unambiguous that Technology was the dominant liquidity sink at the start of the prior week on the MSCI rebal date, with roughly $98bn traded on Monday alone, completely eclipsing every other sector. That was followed by a sharp normalization into the low-to-mid $40bn range for Technology across subsequent sessions, where it remained persistently at or near the top of the leaderboard through Friday. Communication Services consistently printed in the low-to-mid $40bn area on its stronger days as well, keeping it firmly in second position on a recurring basis. Large Caps oscillated between the mid-teens and high $30bns, with a notable expansion into the high $30bn range late in the week. Financial Services, Industrials, and Consumer Discretionary clustered tightly in the low-to-mid teens on most days, while Healthcare and Materials hovered just below that range. Consumer Staples remained structurally smaller in dollar terms, generally in the high single billions to low teens, signaling persistent but secondary participation. The shape of this distribution shows that this was a technology-first liquidity event for MSCI. Upcoming rebals for VL subs to mark:
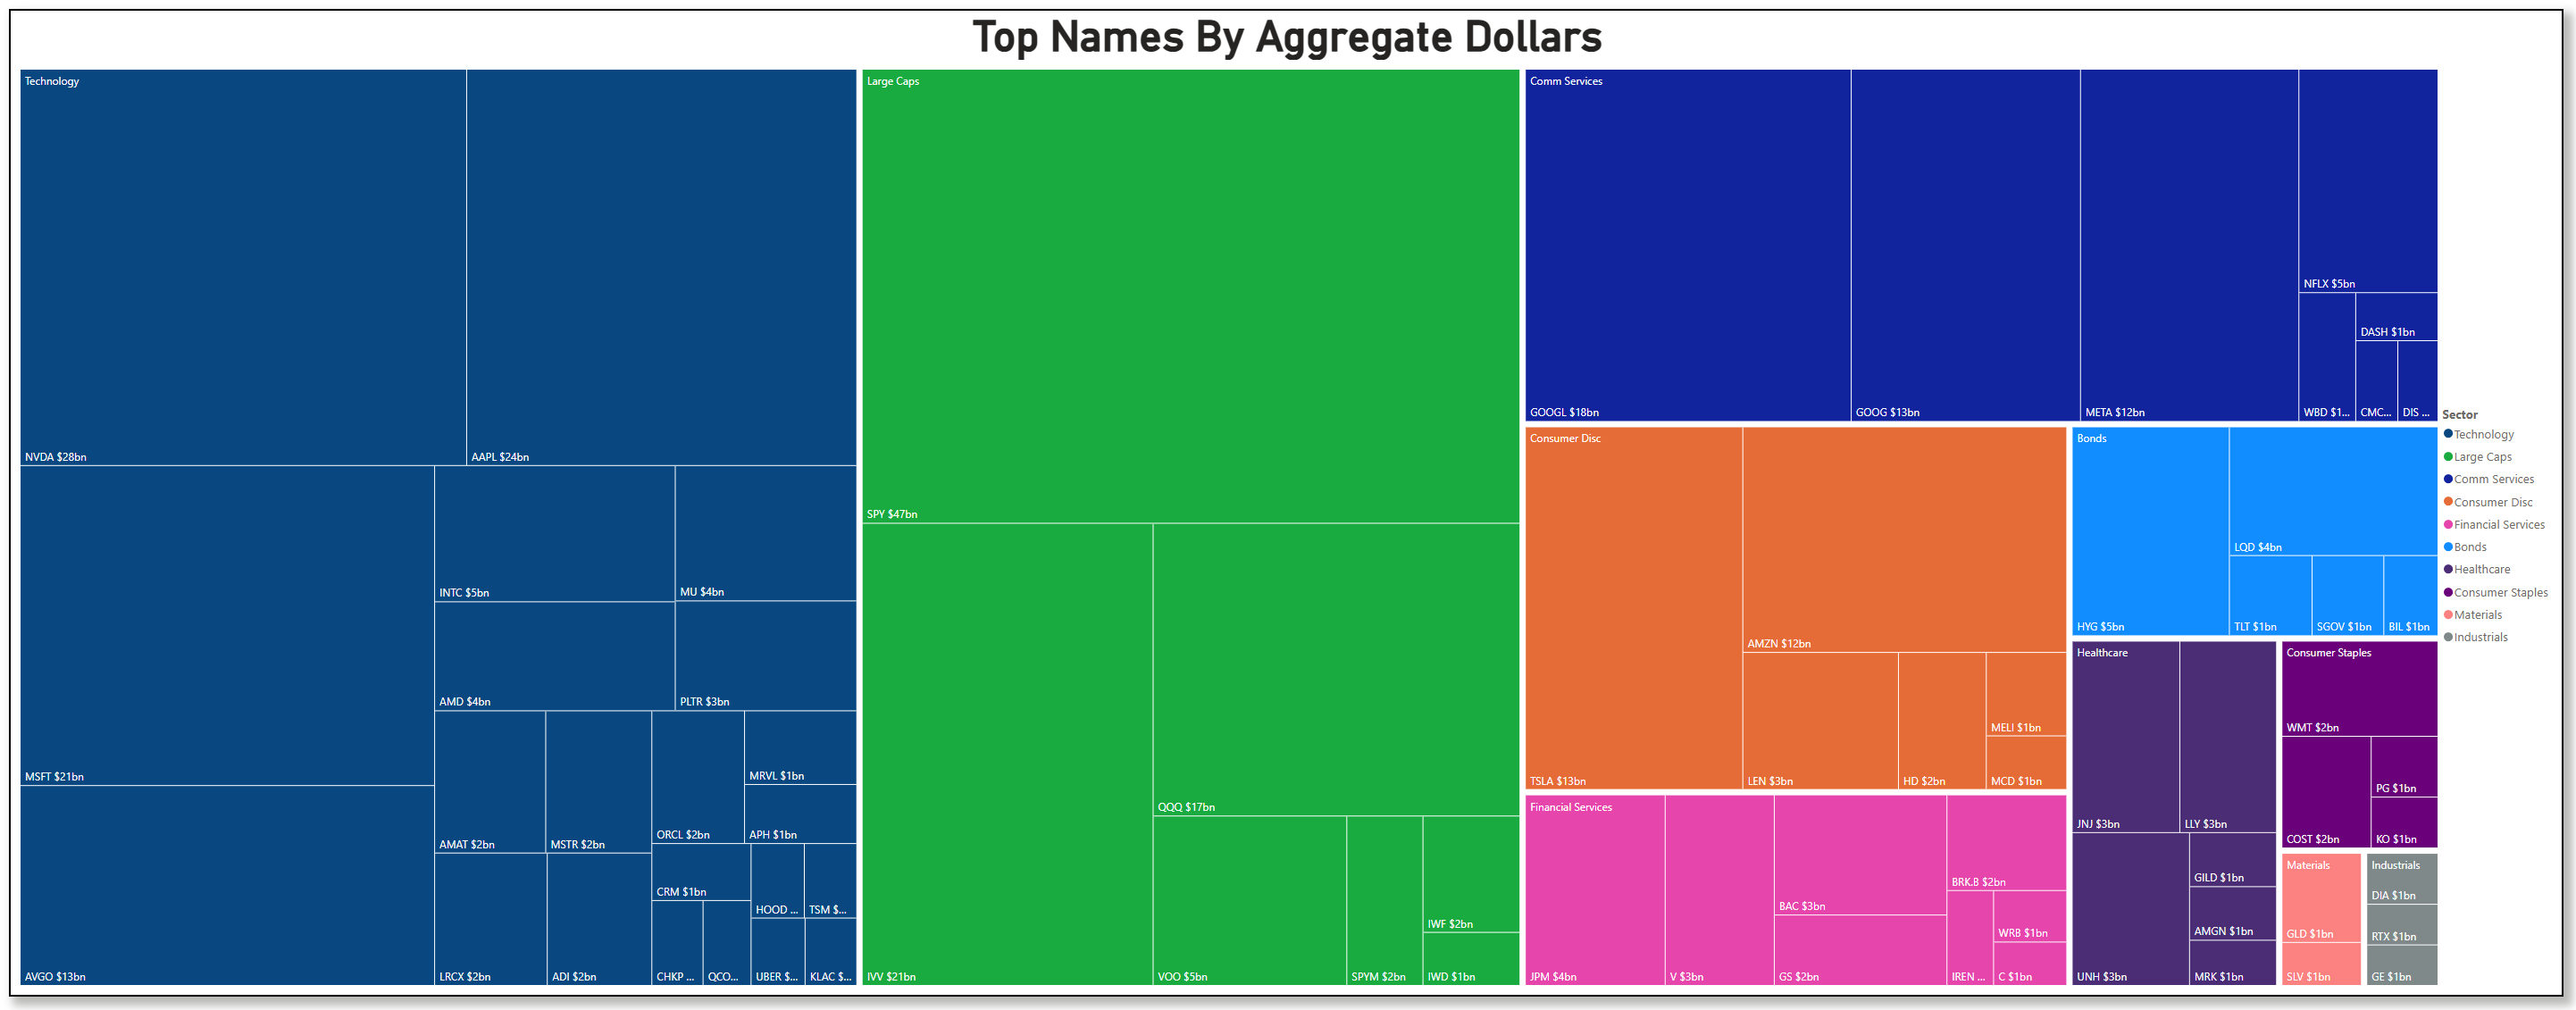
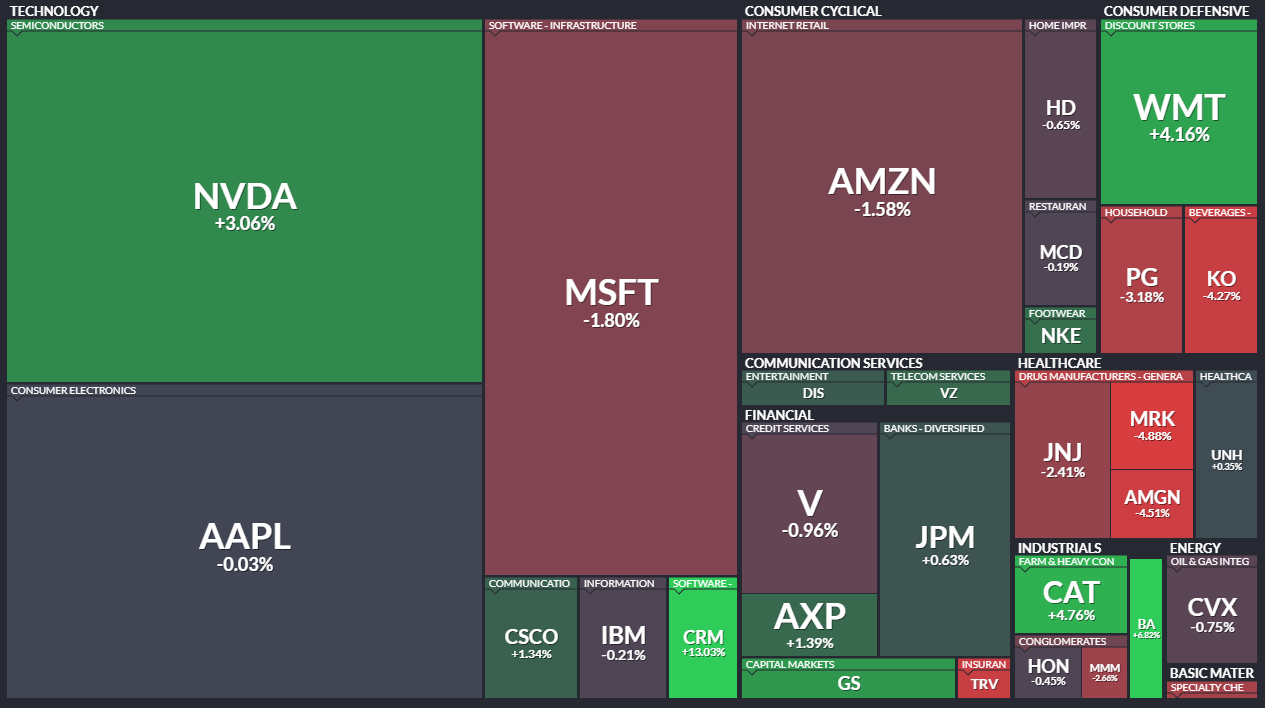
The treemap makes the concentration of that flow obvious. SPY alone accounts for roughly $47bn of aggregate dollars, dwarfing everything else. Right behind it sits the AI complex: Nvidia (NVDA) around $28bn, Apple (AAPL) near $24bn, and Microsoft (MSFT) in the low-$20bns via the IVV sleeve. The rest of the Technology block is broad but thin – Intel (INTC), Micron (MU), Advanced Micro Devices (AMD), Broadcom (AVGO), Salesforce (CRM) and others in the $1–$5bn bracket – which tells you that while the AI narrative is still being expressed primarily through the usual megacaps, there is genuine breadth further down the stack. On the index side, SPY is joined by IVV and VOO in the $20bn and $5bn area respectively, creating a three-ETF backbone of passive US equity risk. For all the talk about stock-picking, this week’s dollars say the primary decision was still “how much equity beta do I want,” not “which obscure factor basket do I love.”
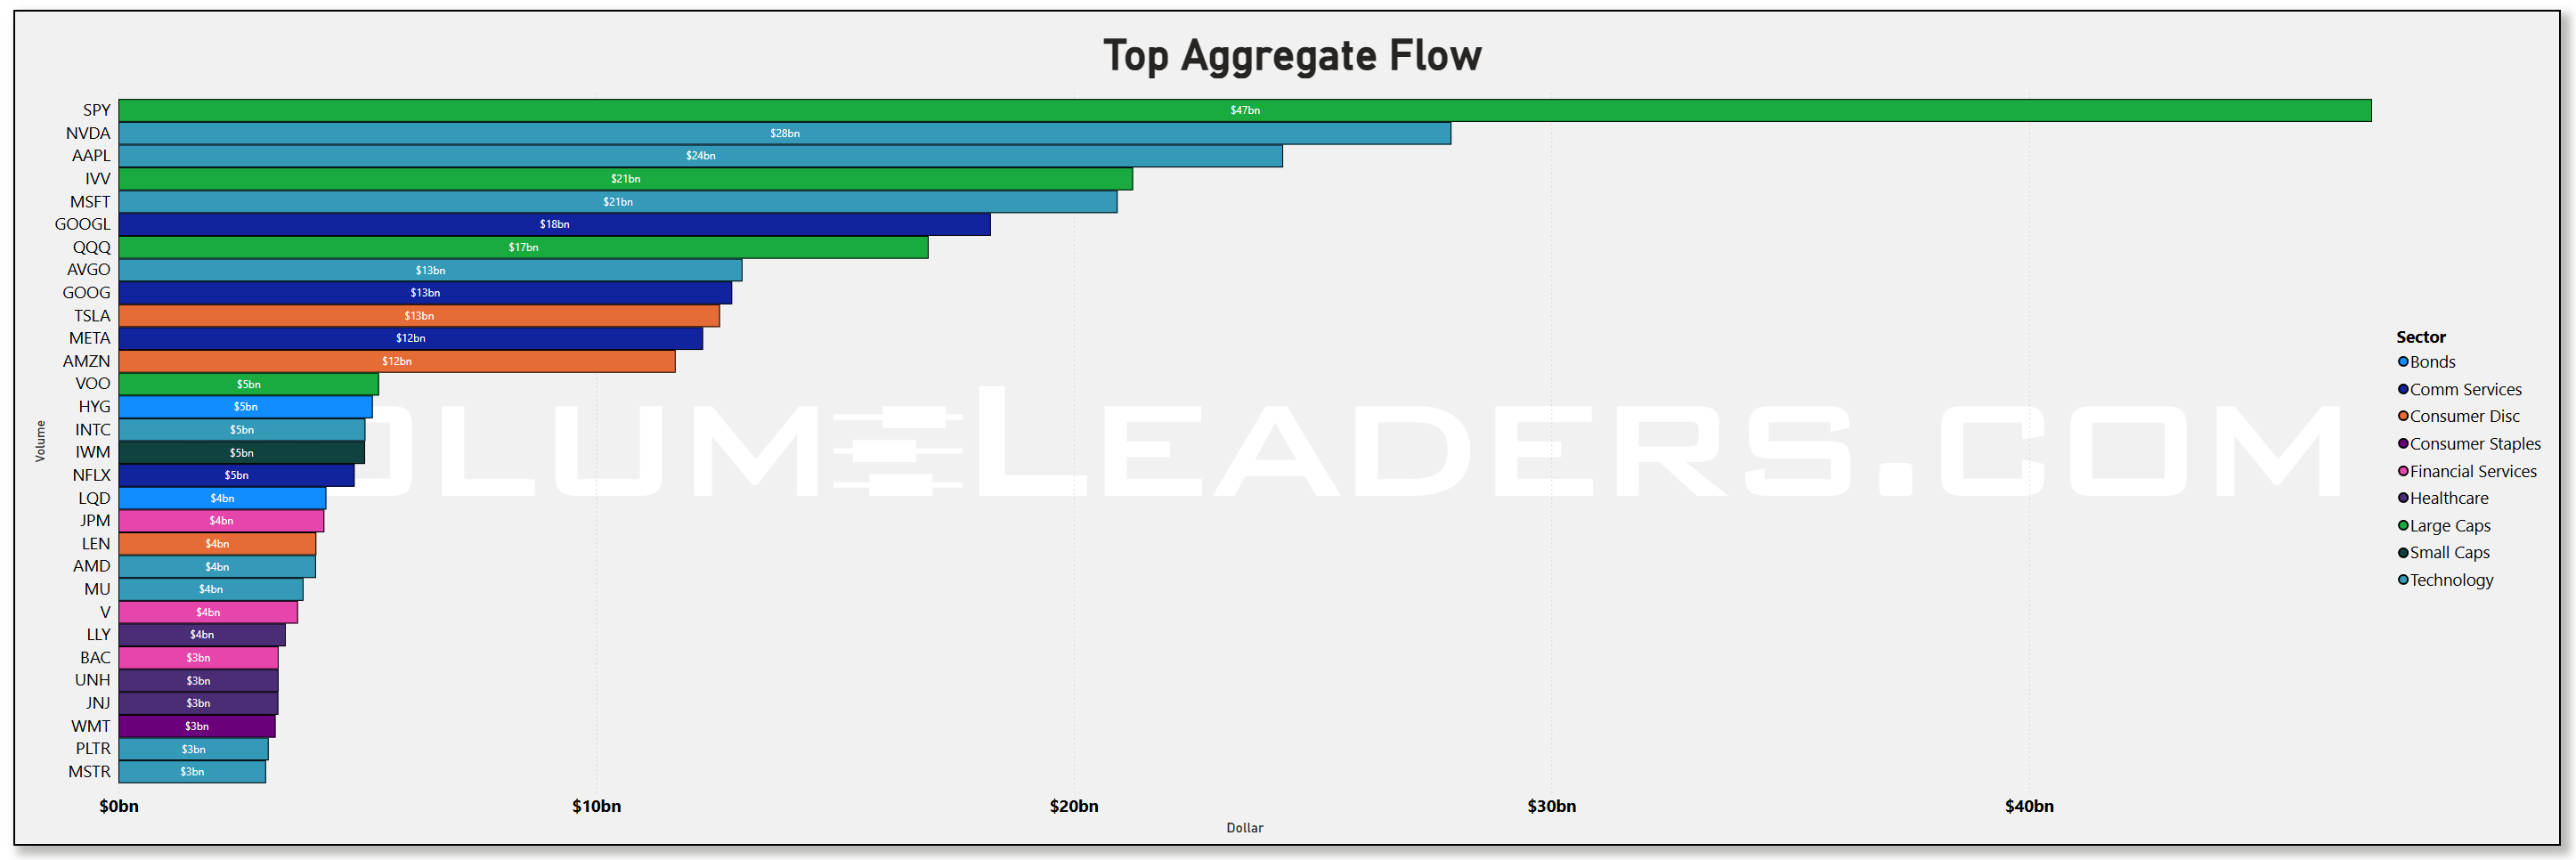
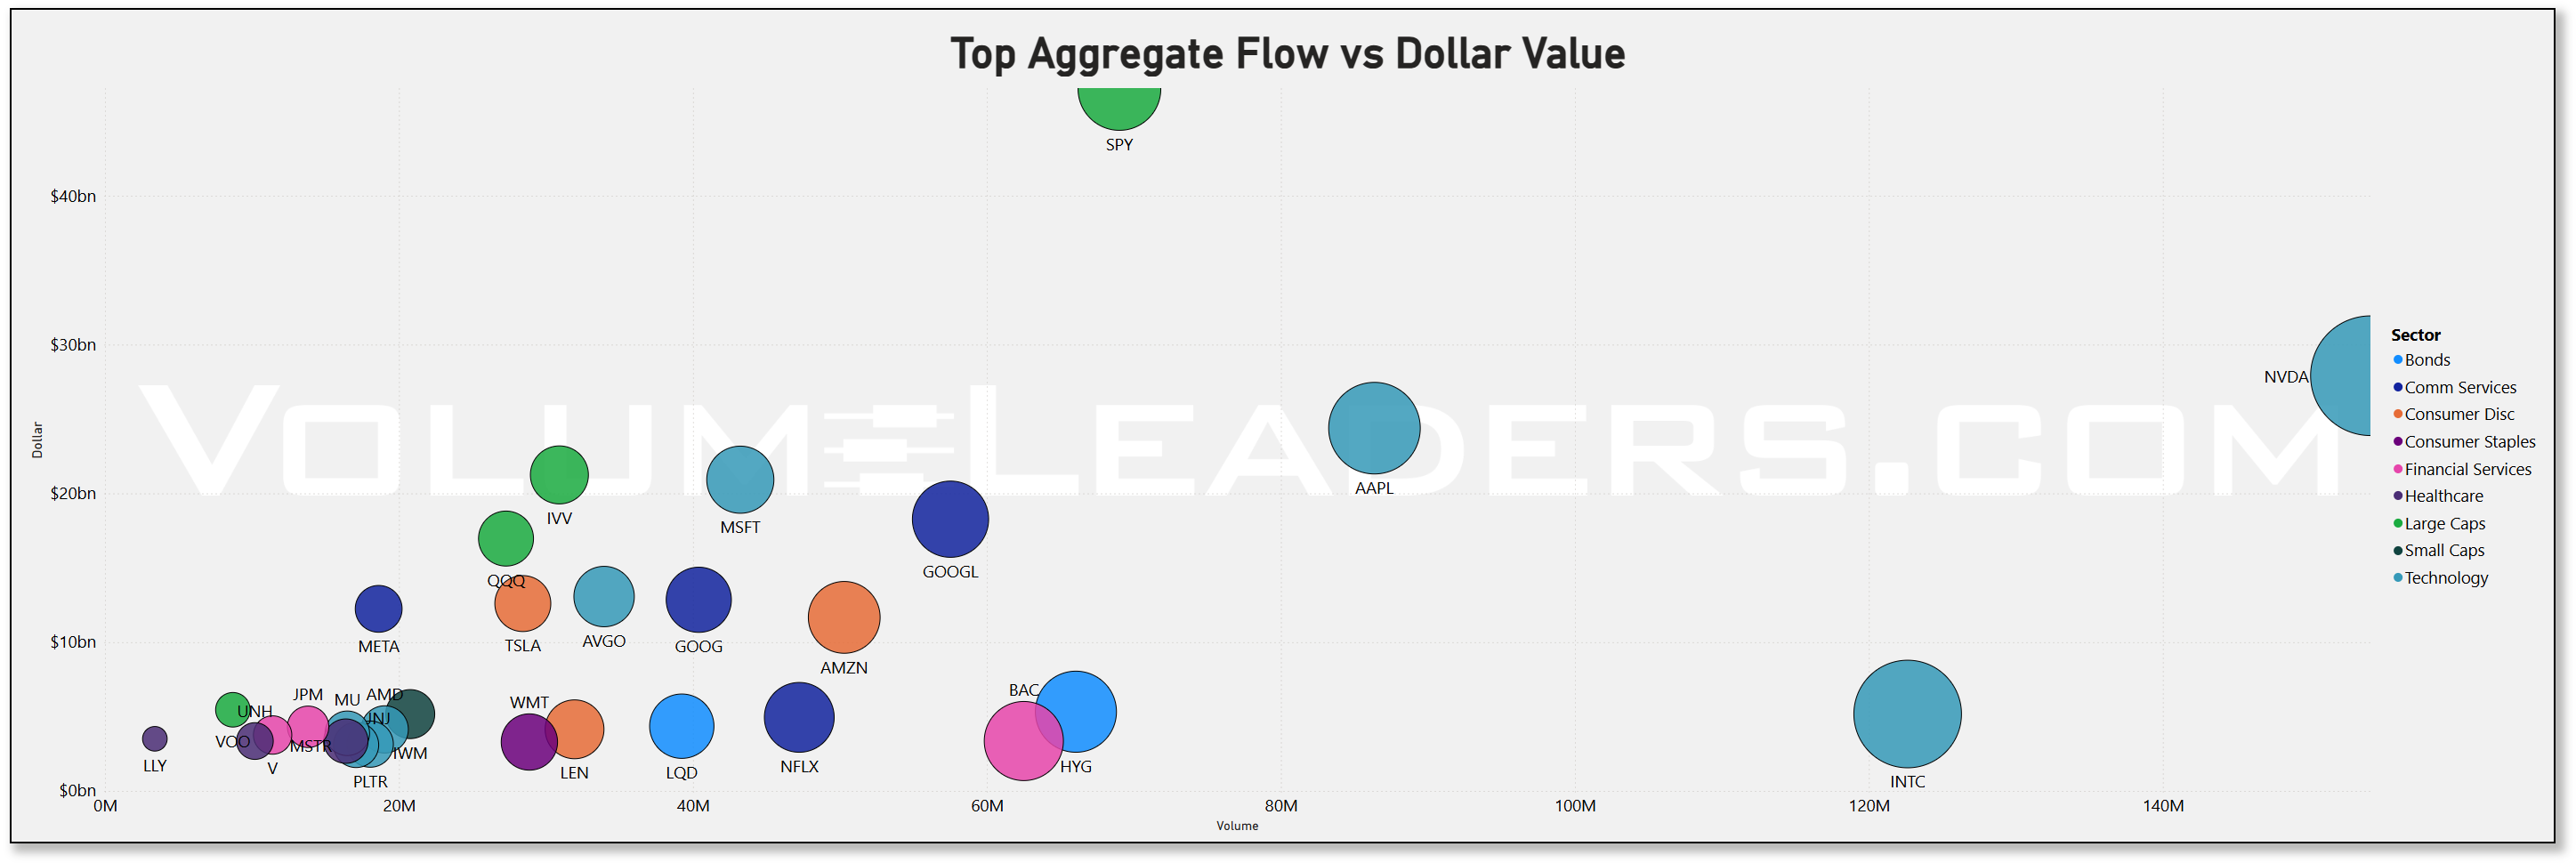
The aggregate-bar and scatter plots reinforce that. On the bar chart, after SPY, NVDA and AAPL you see IVV around $21bn, Alphabet’s two share classes – GOOGL and GOOG – each around $18–13bn, QQQ near $17bn, AVGO and Tesla (TSLA) at ~$13bn, Meta (META) and Amazon (AMZN) at roughly $12bn, with a second tier of flows into VOO, HYG, INTC, IWM, NFLX, LQD and JPM in the $4–5bn range. The scatter shows those same names split into two groups: broad ETFs like SPY, QQQ, IVV and VOO with very high dollar turnover but moderate share volume, and single-name tech where dollars and prints are both elevated. That is the signature of allocators using ETFs to set the risk budget and stock-pickers using semis and megacaps to express conviction inside that budget.
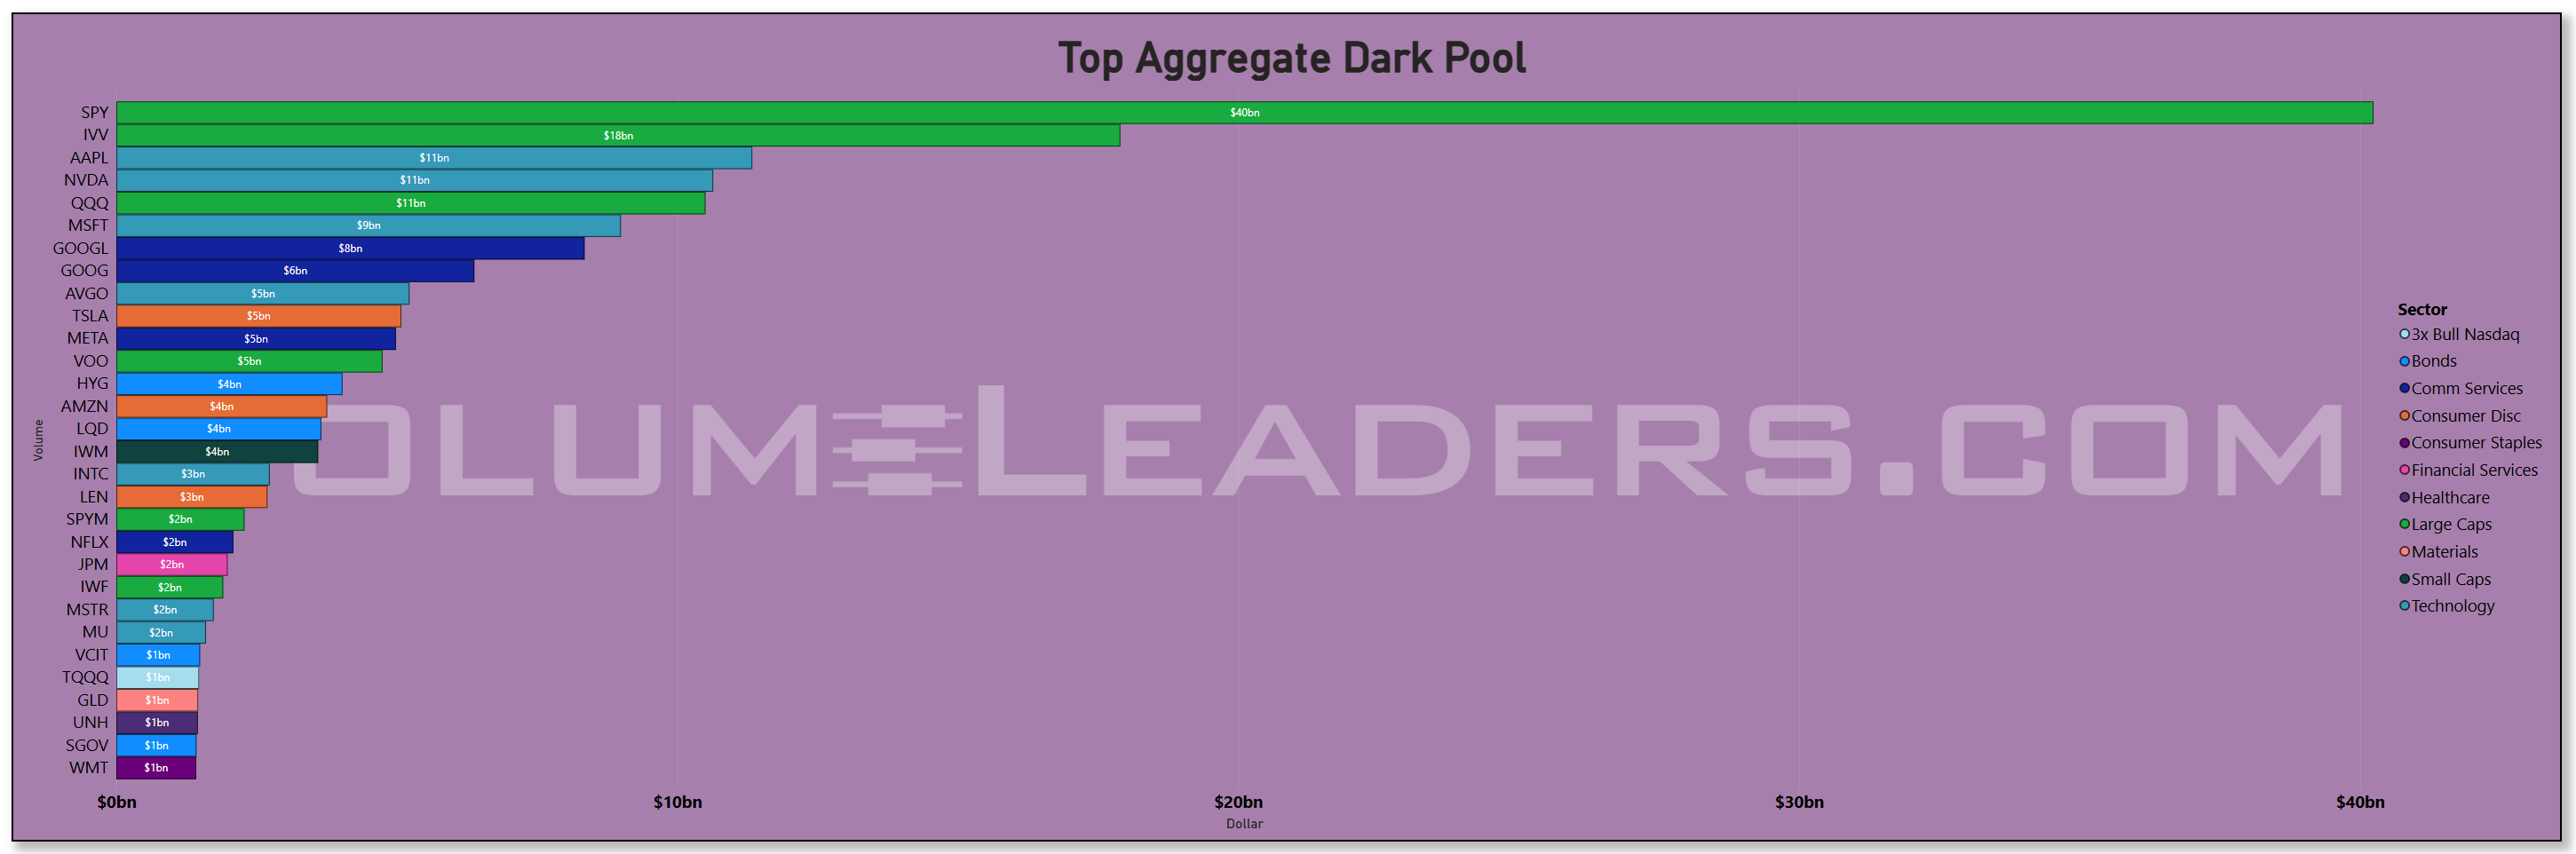
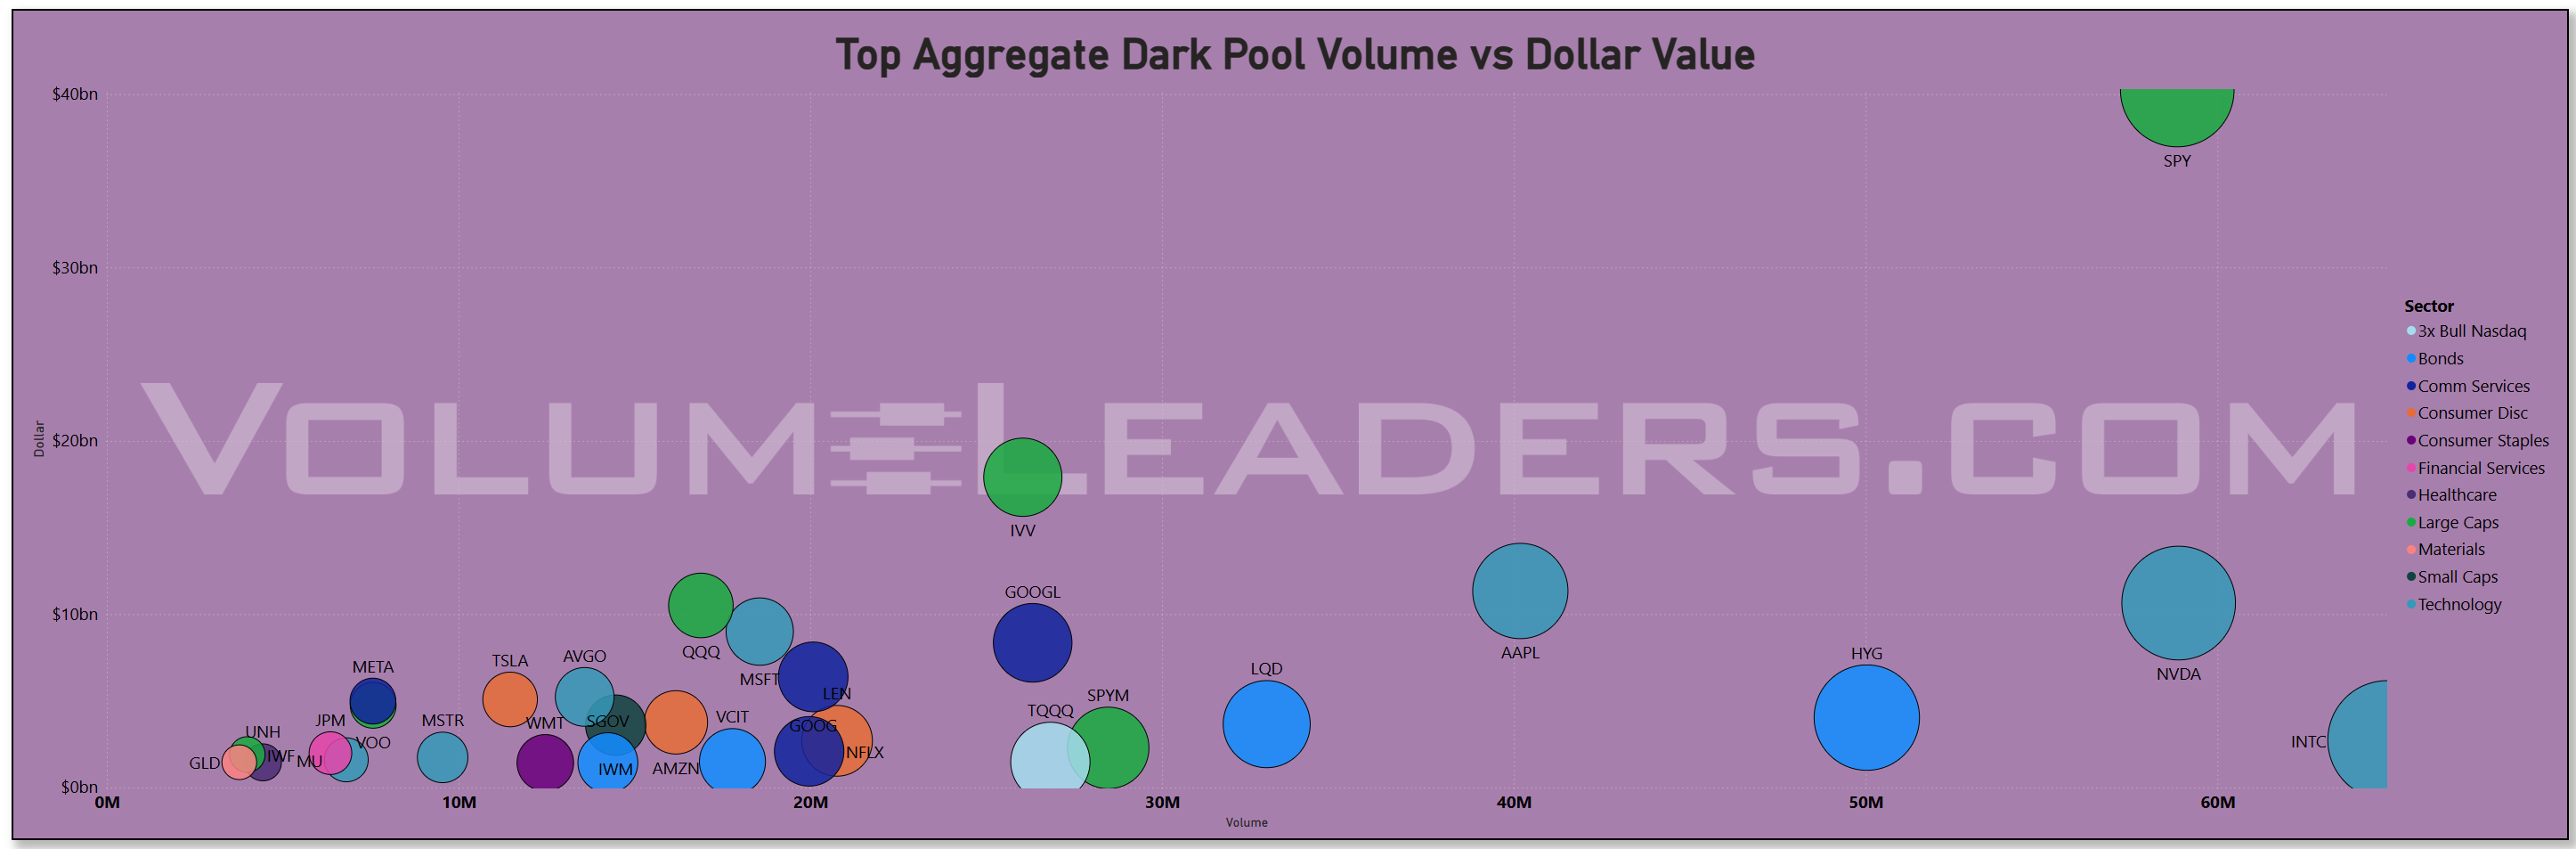
Off-exchange, the dark-pool tape looks like a quiet accumulation program rather than panic hedging. SPY still dominates with about $40bn of dark-pool dollars, but IVV’s ~$18bn stands out as the second anchor, suggesting that real-money accounts are spreading their S&P exposure across multiple wrappers rather than piling into one. AAPL, NVDA and QQQ are all clustered near the $11bn mark, MSFT around $9bn, and GOOGL in the high single-digits. That is a who’s-who list of core AI and index vehicles; seeing them all trade billions off-exchange in the same week is exactly what you expect when institutions are re-building long books but would prefer not to telegraph their size. The presence of HYG and LQD, each around the mid-single-digit billions, and small-cap proxies like IWM and SPYM in the low billions suggests fixed-income and size-tilt risk is being tuned in the dark as well.
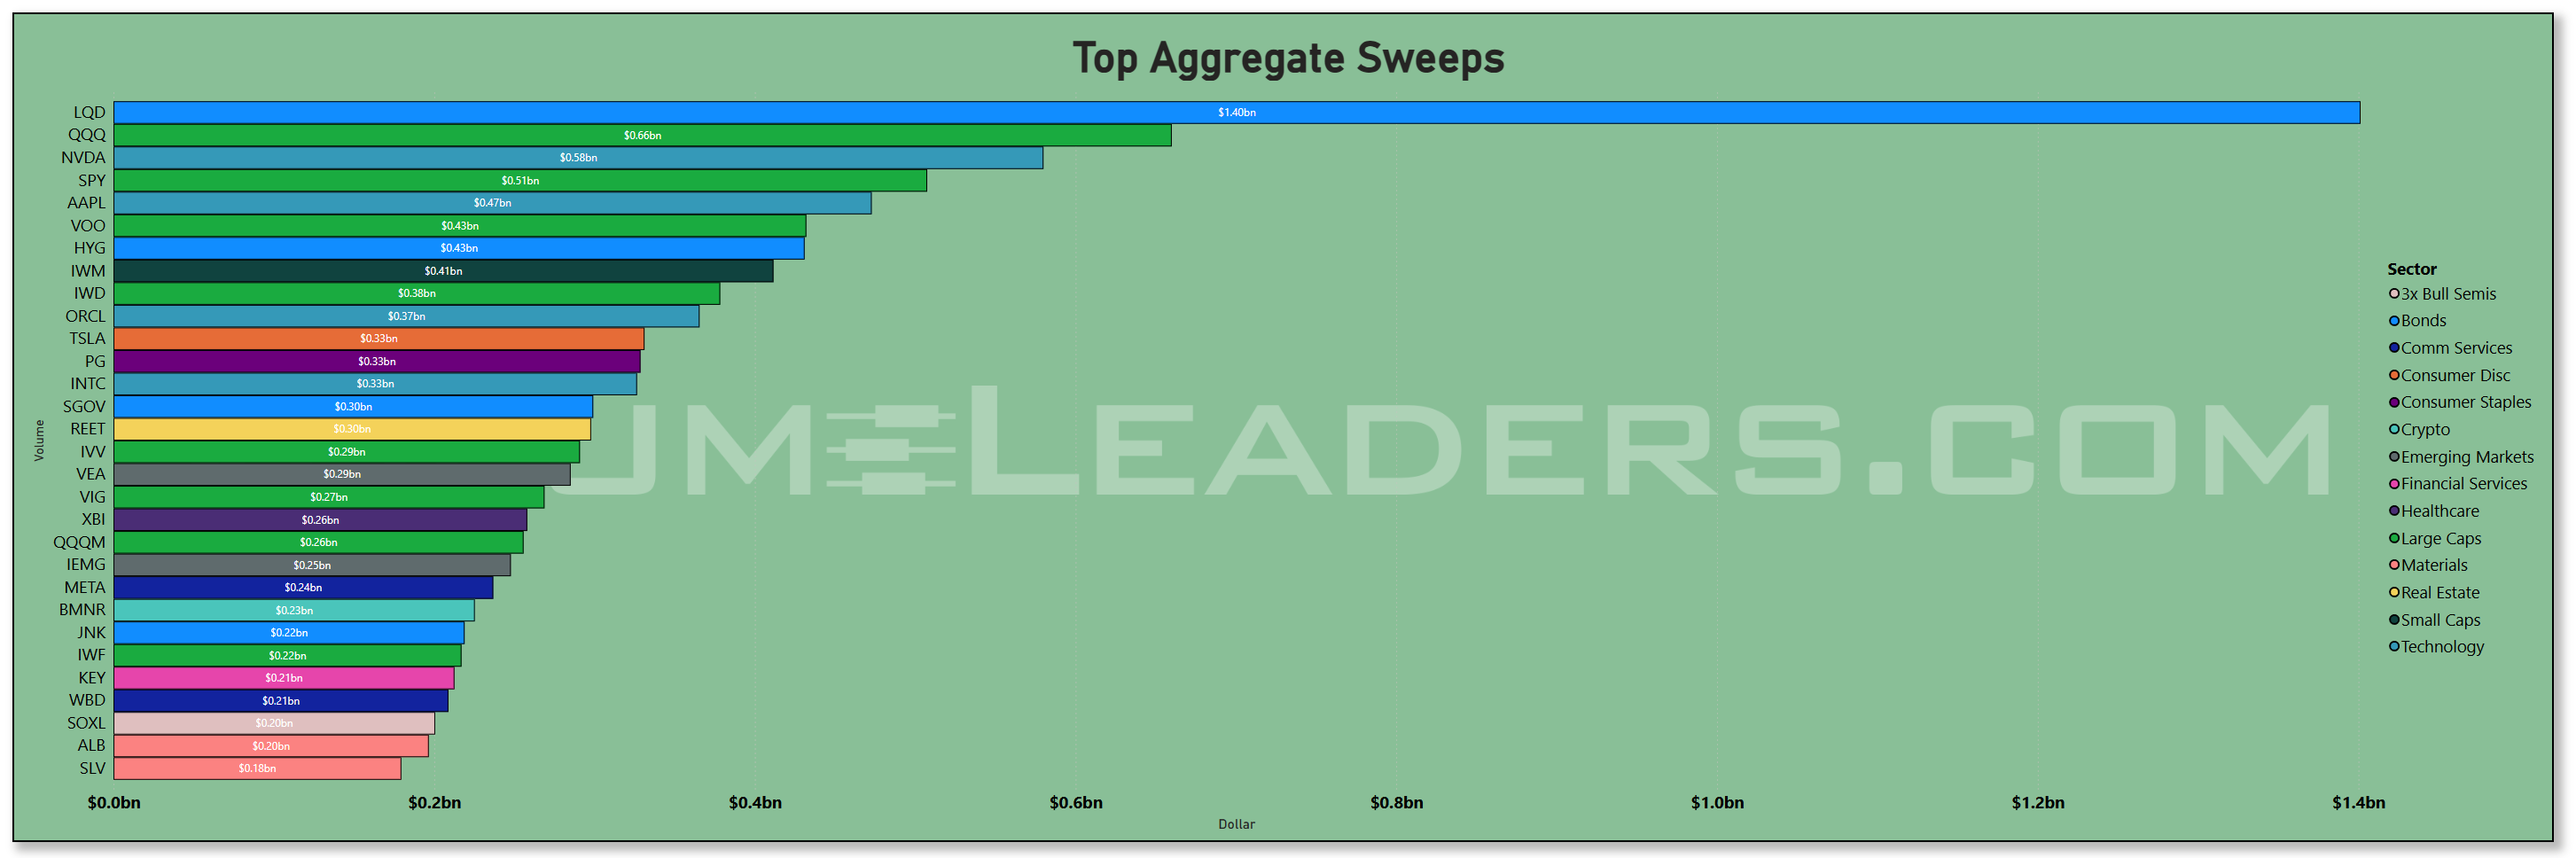
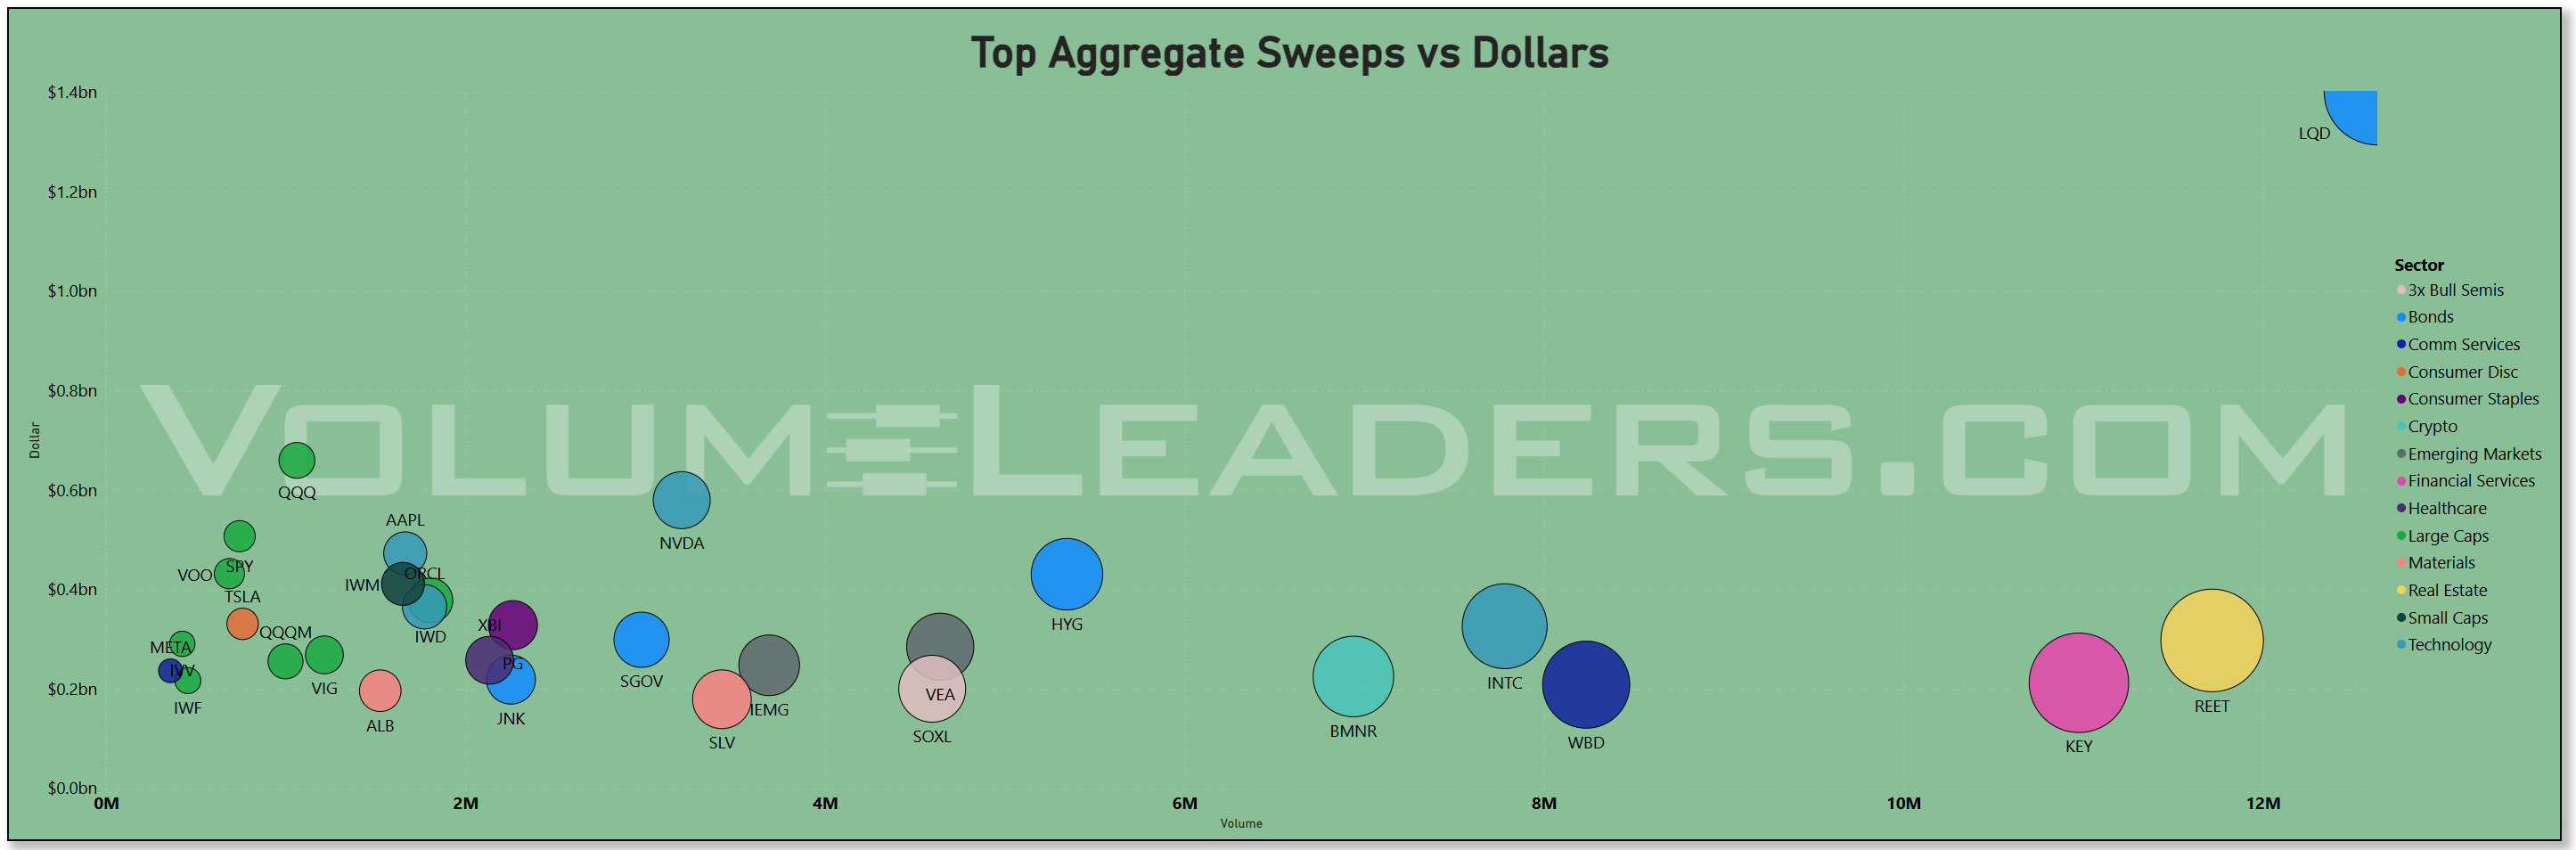
The sweeps tape tells you where the hot money went. LQD is the largest single sweep destination at roughly $1.40bn, well ahead of anything else. That is not the behavior of a market terrified of credit; it is a classic “get invested in IG credit now and fine-tune later” move. Behind it, QQQ (~$0.68bn), NVDA (~$0.58bn), SPY (~$0.51bn) and AAPL (~$0.47bn) dominate, with VOO, HYG, IWM, IWD and ORCL in a broad $0.3–0.4bn bracket. Smaller but notable sweeps in TSLA, INTC, SGOV, REET, VEA, XBI, META, JNK, KEY, WBD, SOXL, ALB and SLV round out the list. Put together, that is an “all-gas but hedged” posture: fast money leaning into equity beta and AI leaders while simultaneously ramping corporate-bond and high-yield ETFs to monetize a softer-policy backdrop through carry.
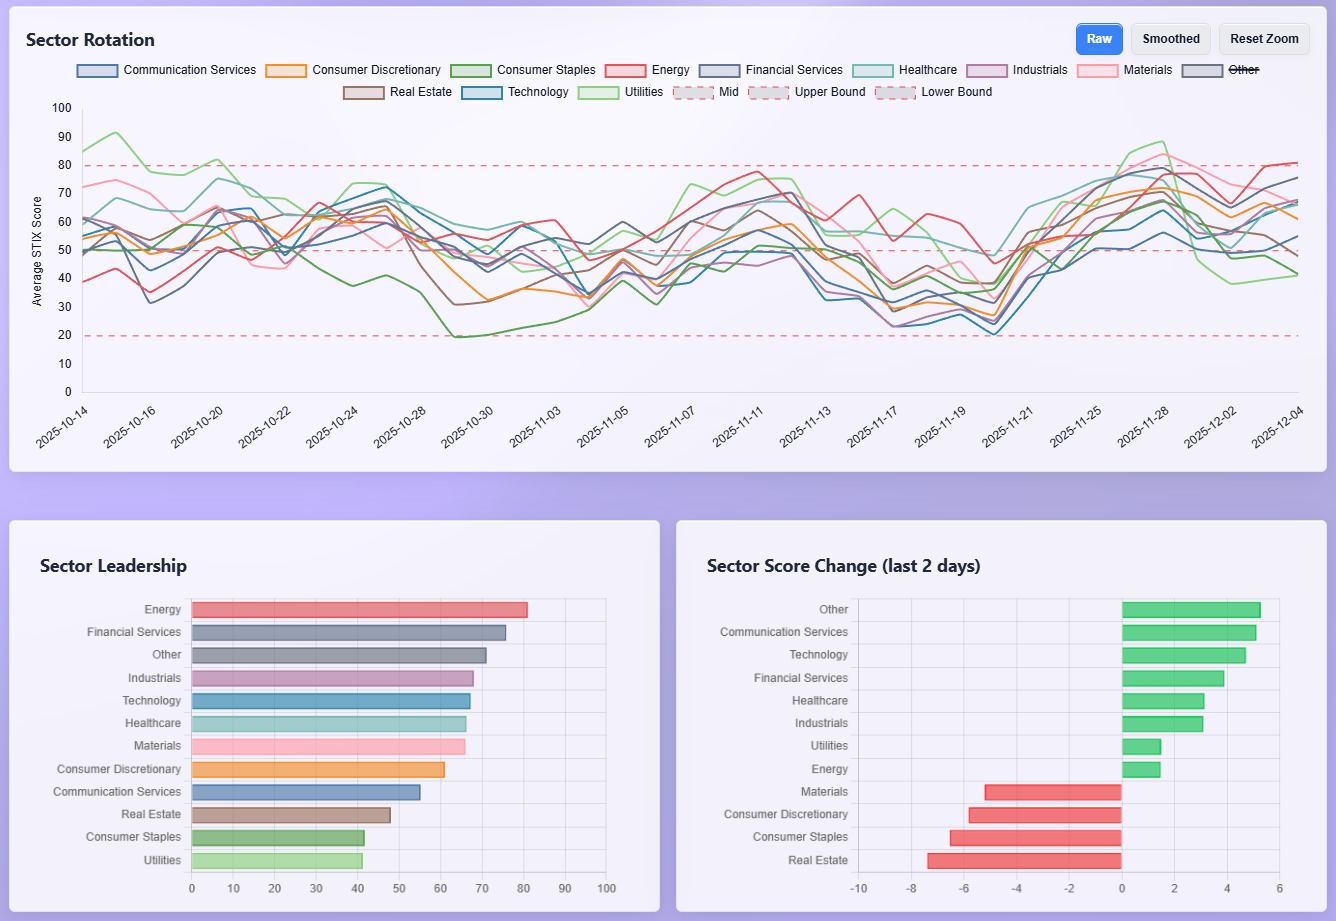
The sector-rotation dashboard pulls the story together. On a level basis, Energy sits at the top of the stack, followed by Financials, a catch-all “Other” bucket, Industrials, Technology and Healthcare; Consumer Discretionary, Communication Services, Real Estate, Staples and Utilities lag. But the last two days’ momentum has clearly shifted toward Communication Services, Technology, Financials and Healthcare, all registering positive score changes, while Real Estate, Staples and Discretionary have rolled over. That is exactly what you would expect when the macro narrative evolves from “will the Fed cut” to “how much duration and equity risk can I responsibly add.” Growth-sensitive, rate-sensitive sectors are seeing incremental demand; yield-oriented, bond-proxy sectors are being harvested to fund it.
Macro context helps explain why the tape looks this way. After a year of cutting, the Federal Reserve has taken the policy rate down to a 3.75–4.00% target range as of its late-October meeting, while signaling that future moves will be data-dependent but skewed toward further easing if inflation continues to cool. Headline inflation, meanwhile, has drifted down toward the 3% area on a 12-month basis, a far cry from the levels that forced the original tightening campaign, even if it remains above the Fed’s long-run 2% goal. The unemployment rate is hovering a bit above 4%, with job growth slowing but still positive, reinforcing the “soft landing, not hard recession” narrative that equities are now pricing. Politically, markets have also had to digest the fallout from this year’s prolonged government shutdown and subsequent budget deal, which ended the immediate fiscal cliff and guaranteed back pay for furloughed federal workers but left longer-term questions about spending and deficits unresolved. In combination, those factors argue for a world where the cost of capital is falling slowly, inflation is no longer spiraling, and policy risk has shifted from “too tight for too long” toward “how quickly can conditions normalize.”
Against that backdrop, it makes sense that institutional money is expressing its view through three main channels. First, heavy, steady flow into SPY, IVV and VOO on both lit and dark venues says asset allocators are rebuilding US equity exposure after a volatile autumn, not de-risking. Second, the persistent presence of NVDA, AAPL, MSFT, GOOGL, AVGO and TSLA at the top of both lit and dark-pool dollar rankings shows that AI and quality growth remain the preferred way to express upside in that exposure. Third, the leadership of LQD and HYG in the sweeps tape signals that credit – particularly investment-grade – is being used as a high-conviction carry trade now that nominal yields have retreated off their peaks but are still attractive in real terms.
Bottom line: this week’s tape shows institutions quietly re-levering into US equity beta and high-quality growth, funding the move with bond-proxy sectors while simultaneously loading up on corporate-credit carry, a posture that only changes if index and megacap flows lose their grip on the top of the leaderboard. Anchor risk to key index levels from the Technician’s Playbook and while those are respected, try to embrace the holiday grind.
MIR Part 2: Individual Names From The Institutional Tape
VolumeLeaders tracks several proprietary signals designed to spotlight names drawing significant institutional interest. Below, we’ve surfaced the latest results and analyzed them to highlight emergent themes. If any of the sectors, narratives, or positioning trends resonate, the names mentioned here offer a strong starting point for deeper research and watchlist consideration.
VL Trade Rank Velocity™ (TRV)
TRV is a proprietary metric that measures the recent acceleration or deceleration in institutional trading activity for a given stock by comparing its average trade rank over the past few days to its average in recent weeks. A sharp improvement in TRV typically reflects a notable shift in positioning, often accompanied by sustained trade activity, suggesting institutions are actively engaging with the name and that intensity of activity is rising. This often precludes meaningful price or narrative shifts. This isn’t a buy-list or sell-list; it’s meant to draw your eyes to names where institutions are putting money to work.
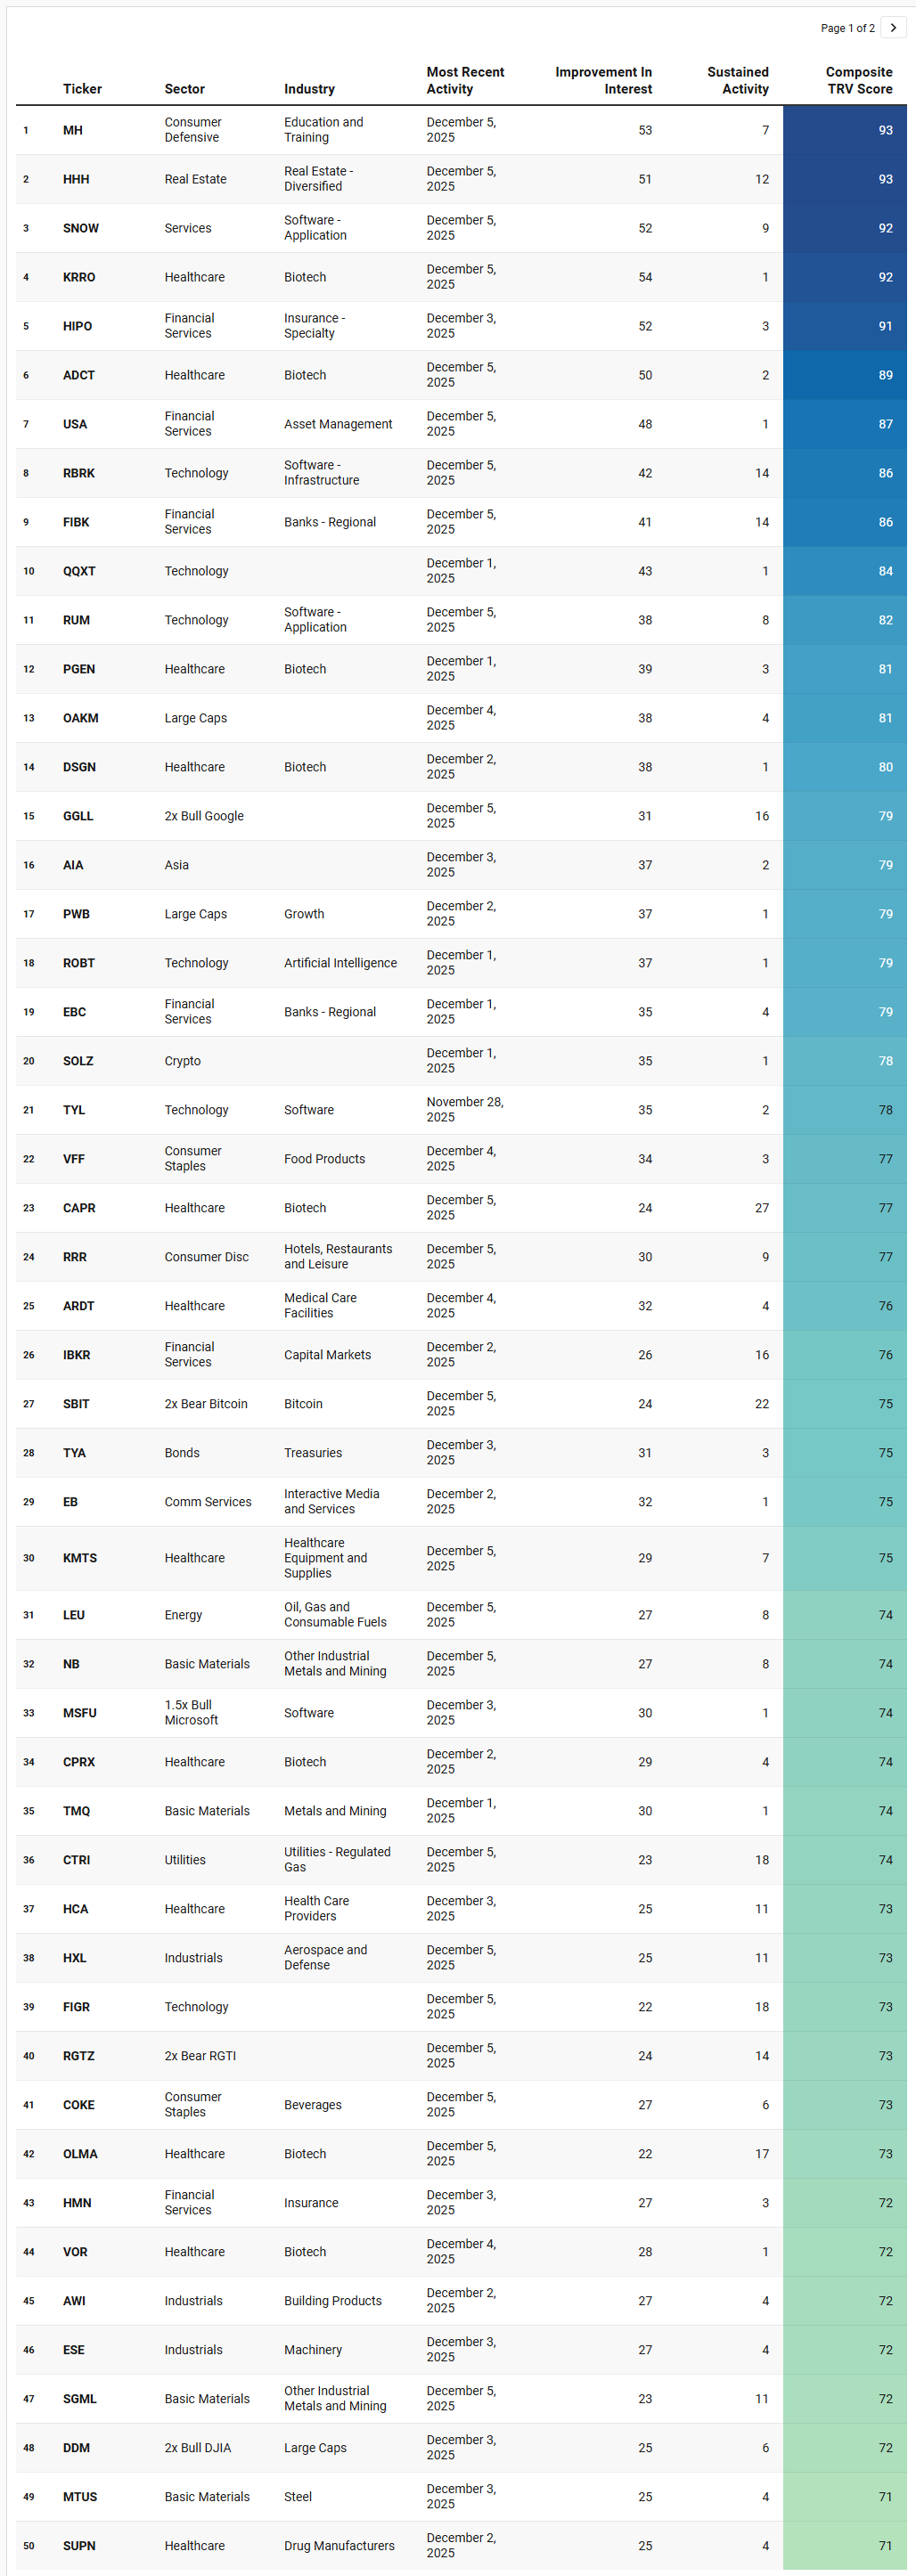
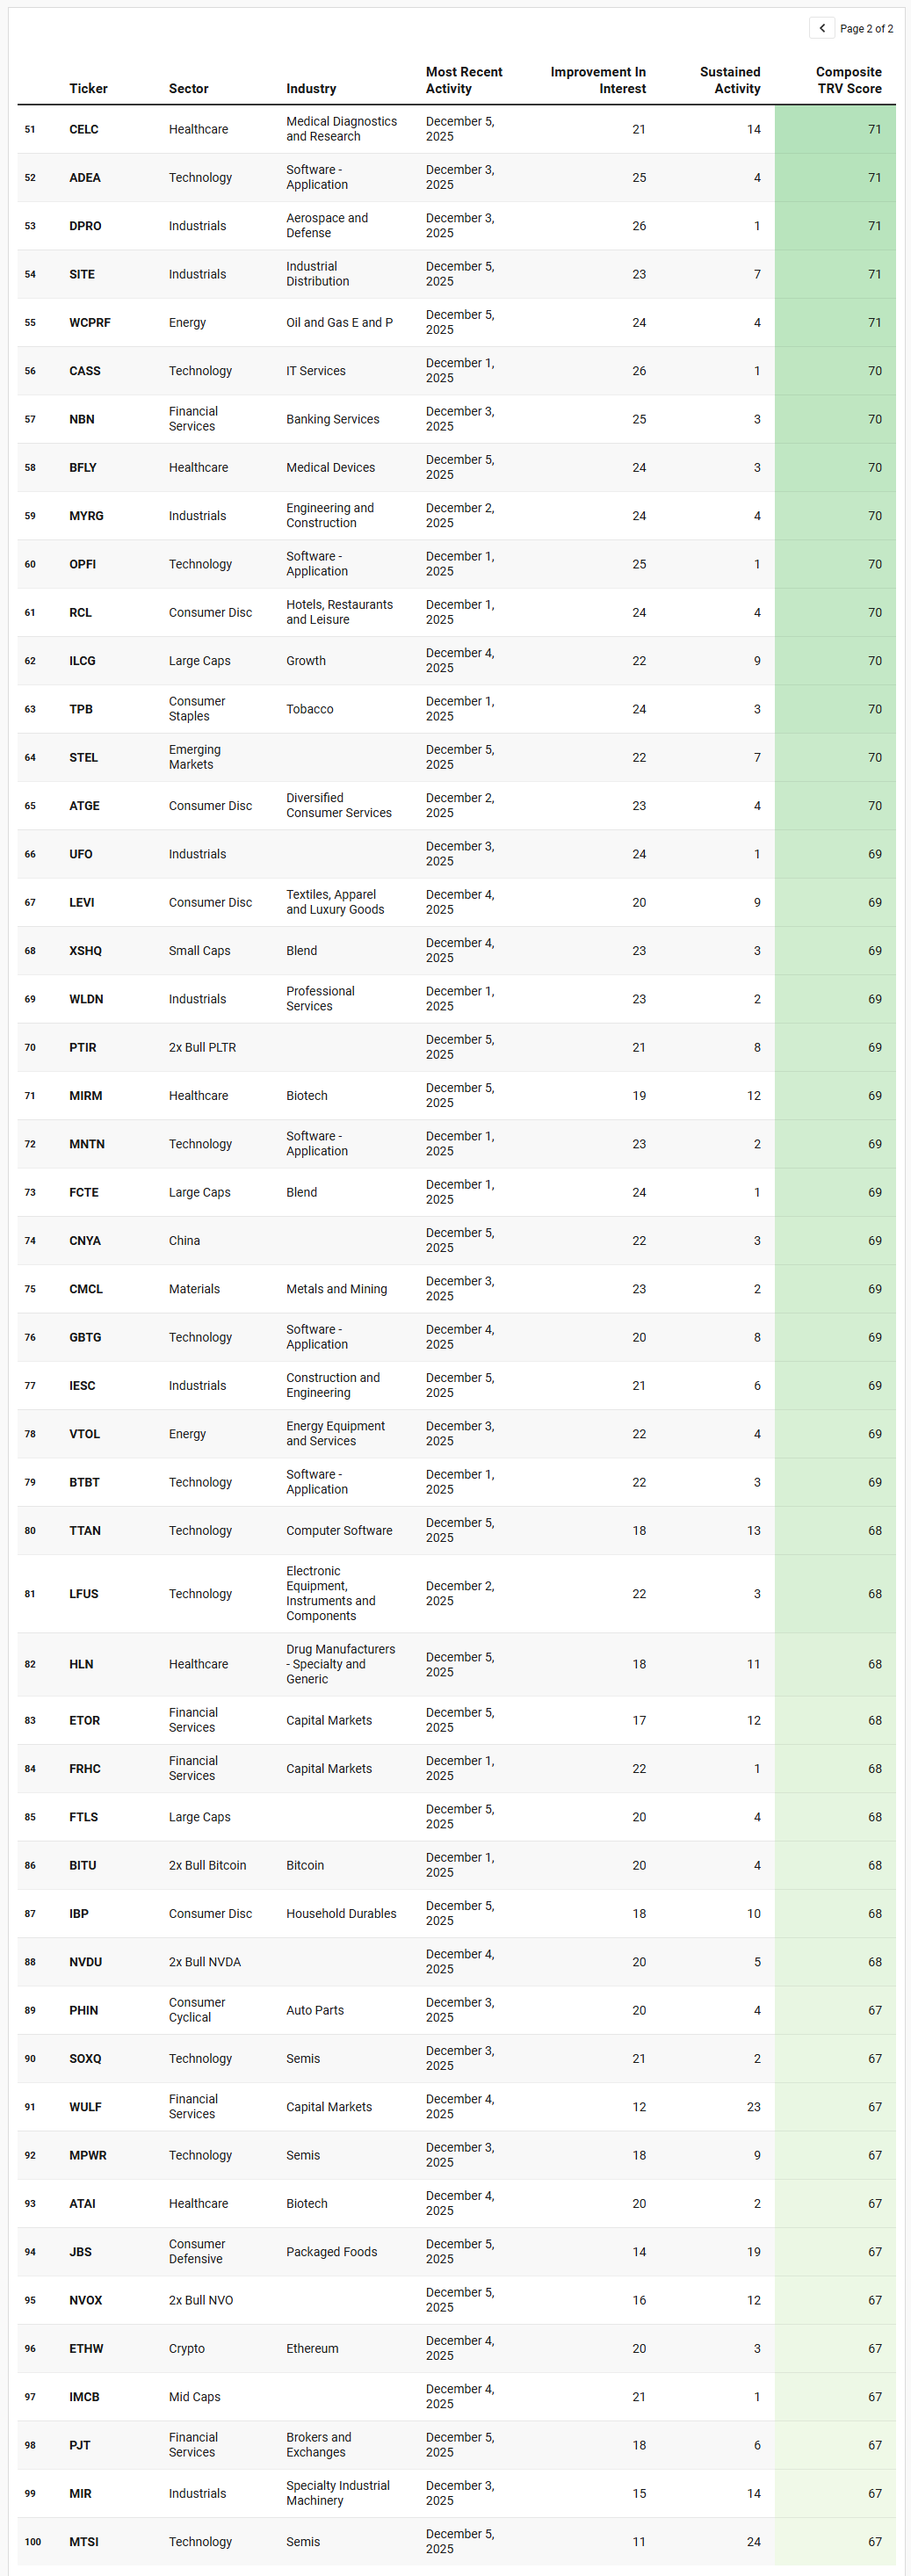
What immediately stands out from this week’s TRV watchlist is how cleanly it confirms and deepens the same story the tape and sector liquidity already told: this remains a technology-first, infrastructure-and-compute-adjacent, selectively cyclical market, with speculative expression increasingly being expressed through levered single-name and crypto proxies rather than broad beta.
The most dominant emergent theme is software and digital infrastructure as the organizing spine of speculative interest. Snowflake (SNOW), Rubrik (RBRK), Rumble (RUM), Adeia (ADEA), Opfi (OPFI), Mountan (MNTN), Globetravl (GBTG), TTM Technologies via TTAN, Cass Information (CASS), and multiple other application and infrastructure software names populate the upper half of the list. These are not momentum darlings clustered around a single headline catalyst; rather, what the sustained-activity column shows is a broad, persistent re-engagement with the digital plumbing of the economy. This lines up exactly with what we saw in the sector dollar data and megacap flows: capital is not abandoning the AI and cloud build-out trade, it is expanding laterally into the second derivative beneficiaries of data growth, enterprise tooling, and transaction infrastructure.
That software theme then tightens into a very visible semiconductor and hardware execution pocket. SOXQ, MPWR, LFUS, and MTSI all appearing together tells you that capital is not only staying with the headline GPU narrative, but is working down the stack into power management, components, and test-and-measure. This is precisely how late-stage institutional positioning typically matures: first the index and the megacap flagships, then the enabling hardware vendors with operating leverage. The simultaneous presence of NVDU, MSFU, and PTIR, all 2x single-name vehicles, reinforces the same message that showed up in the sweep data earlier in the week: institutions are increasingly expressing conviction through leverage rather than through incremental spot exposure.
Crypto also shows up as a parallel speculative spine, but notably in both directions. BITU and ETHW on the long side sit directly alongside SBIT on the short side, signaling that crypto is being actively traded as a volatility instrument rather than passively accumulated. That dual presence fits the broader liquidity profile we saw earlier: this is not a one-way crypto accumulation phase, but a tactical regime in which crypto is being used as a high-beta expression vehicle for macro and rate impulses. The fact that both Bitcoin and Ethereum leveraged products scored highly at the same time underscores how central digital assets have become to short-cycle institutional trading.
Healthcare’s footprint across the list is also impossible to ignore, but the pattern matters. The dominance of early-stage biotech and specialty medical technology names such as KRRO, ADCT, PGEN, DSGN, CAPR, OLMA, VOR, SUPN, CELC, ATAI, and MIRM tells a very different story than a defensive healthcare rotation. This is risk-seeking healthcare, not risk-off healthcare. It suggests that while technology draws the bulk of systematic capital, discretionary alpha-seekers are still actively hunting idiosyncratic upside in binary science. That plays well with the broader observation that institutions are comfortable carrying both growth beta and bespoke event risk simultaneously, a hallmark of a constructive liquidity environment.
Industrials form a quieter but structurally important third pillar in the list. HXL, DPRO, AWI, ESE, SITE, MYRG, IESC, MIR, and WLDN collectively trace a very consistent narrative around defense, construction, distribution, and specialty manufacturing. This is not cyclical whipsaw; it is project-driven capital tied to multi-quarter backlogs in infrastructure, defense spending, and onshoring. When those names appear with sustained activity rather than one-week spikes, it signals that institutions are still underwriting real-economy build-out alongside digital build-out, not choosing one at the expense of the other.
Financials show a bifurcated structure that mirrors what we observed in the broader flow data. Regional banks and insurance specialists such as FIBK, EBC, HMN, and HIPO are present alongside capital-markets names like IBKR, PJT, FRHC, ETOR, and WULF. This mix suggests that credit stress is not the defining driver right now; instead, transactional and advisory activity is being selectively accumulated, consistent with an equity tape that remains functional rather than fragile. The leveraged Dow proxy DDM appearing further reinforces that institutional risk is being expressed through index-adjacent vehicles rather than pure stock picking at the margin.
Energy and Materials show up quietly but persistently through LEU, WCPRF, VTOL, NB, TMQ, SGML, MTUS, and CMCL. This is not a headline oil trade; this is a supply-chain and resource-security trade, spanning uranium, industrial metals, and oilfield services. That fits neatly into the same structural narrative as Industrials: capital is maintaining exposure to hard-asset systems that underpin both energy transition and defense logistics.
Consumer exposure, where it appears, is tellingly split between experiential cyclicals and defensive consumption. RRR and RCL reflect travel and leisure demand; ATGE, IBP, and PHIN express housing-adjacent and durable-goods exposure; while JBS, TPB, VFF, COKE, and MH represent food, tobacco, beverages, and education. This blend implies that the consumer is not being traded as a macro monolith, but as segmented demand pockets, again consistent with a market that is allocative rather than reactive.
Finally, the presence of multiple levered thematic instruments across technology, AI, crypto, and single-name megacaps is the clearest behavioral confirmation of the larger flow narrative you and I have already been building this week. When you see GGLL, MSFU, PTIR, NVDU, BITU, SBIT, and RGTZ clustered throughout the upper quartile of the TRV list, it tells you that institutions are increasingly comfortable expressing both directional conviction and tactical hedging through embedded leverage rather than through options alone. That behavior typically emerges when dealers are providing ample balance-sheet liquidity and when risk managers are allowing gross exposure to rise.
Taken together, the emergent themes from the TRV leaderboard reinforce a remarkably coherent picture. Technology remains the primary gravity well for institutional capital, but that capital is no longer confined to megacaps alone. It is diffusing into software infrastructure, semiconductor ecosystems, AI robotics, and crypto-linked volatility vehicles. Healthcare is absorbing speculative surplus through biotech optionality. Industrials and Materials anchor the real-asset and national-investment narrative. Financials are expressing transactional confidence rather than balance-sheet fear. And across all of it, leverage is becoming the preferred transmission mechanism for short-cycle views.
This remains a market of selective risk-on beneath a disciplined liquidity umbrella, with institutions tilting toward systems that scale digital production, physical infrastructure, and financial throughput at the same time. That combination is exactly what one expects late in a year when managers are both pressing winners and preparing their books for the next regime.
VL Institutional Outliers™ (IO)
Institutional Outliers is a proprietary metric designed to spotlight trades that significantly exceed a stock’s recent institutional activity—specifically in terms of dollar volume. By comparing current trade size against each security's recent normalized history, the metric flags outlier events that may indicate sudden institutional interest but may be missed because the activity doesn’t raise any flags/alerts when comparing the activity against the ticker’s entire history. For example, it’s conceivable that a ticker today receives the largest trade it has had in the last 6 months but the trade is unranked and would therefore be missed by current alerts built off Trade Ranks. Use “Realized Vol” to identify tickers with large price displacement and to size your risk appropriately.
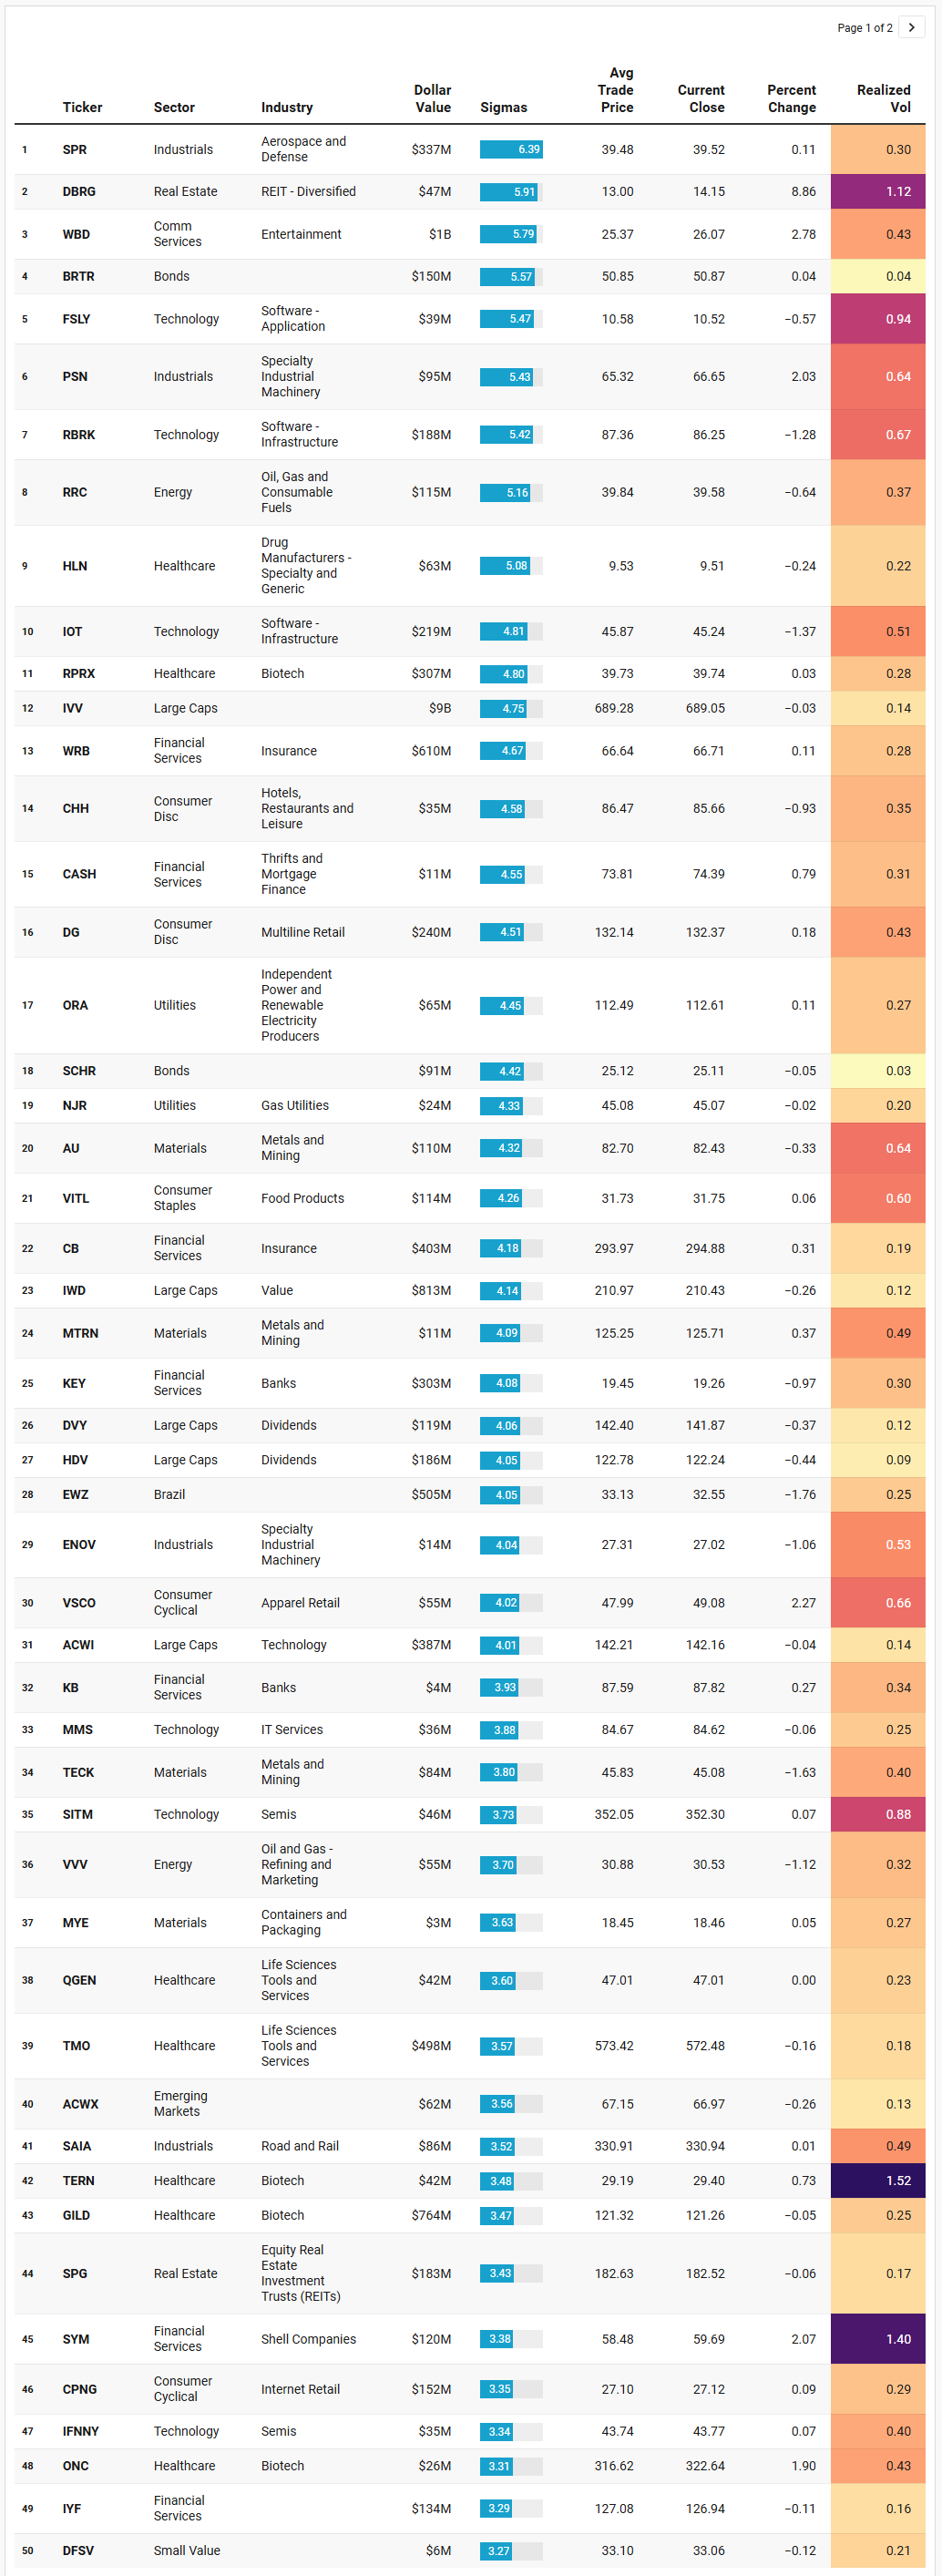
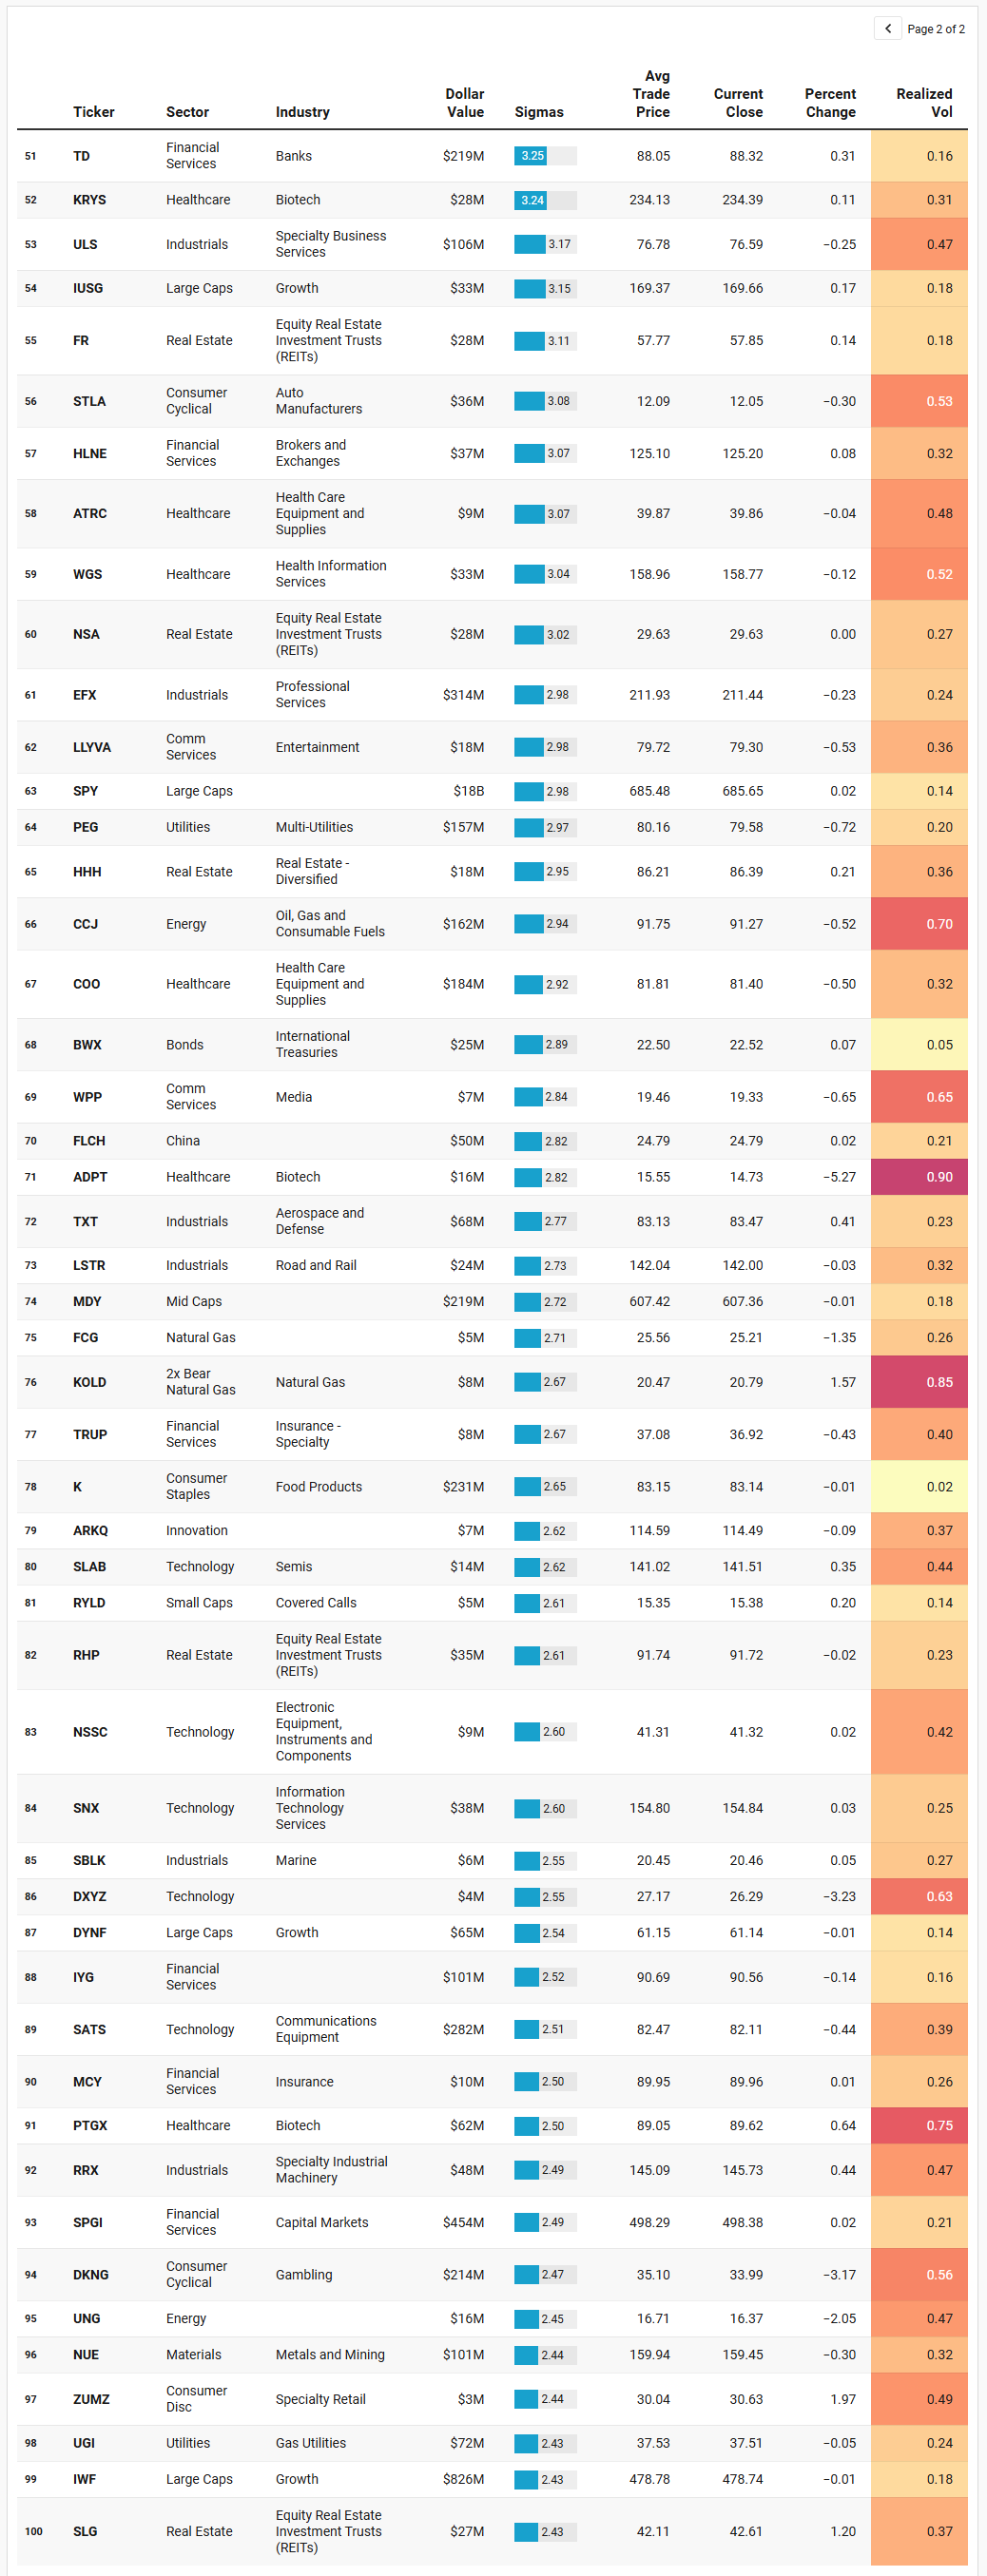
On the Institutional Outliers sheet, we are essentially looking at where the tape screamed that something unusual was happening, even if price barely flinched or the activity wasn’t ranked. Taken together with the TRV list, the message is not a new narrative so much as a sharper, higher-contrast version of the one we already have: large, methodical allocations through the index complex, wrapped in very targeted bets on software, real assets, and a handful of idiosyncratic stories.
Start with the scaffolding. SPY, IVV, IWF, IWD, MDY, DVY, HDV, ACWI, ACWX, IUSG, DYNF, DFSV, IYF, IYG, and RYLD all show statistically extreme dollar prints, many in the high eight to ten figure range, while the percent change on the day is effectively noise. IVV moves about three basis points, SPY two, IWD down roughly a quarter, IWF essentially flat. Realized vol for that complex sits mostly in the low teens. That combination – huge notional turnover, minimal price displacement, very low realized volatility – is the textbook signature of large accounts rebalancing or scaling exposures inside deep liquidity, not panicking or chasing. It tells you that the backbone of this market remains the core index and style ETFs, and that the big money continues to route its risk budget through growth, value, dividend, and mid-cap sleeves rather than abandoning equities outright.
Around that index skeleton, you see the same software and digital-infrastructure theme that dominated the TRV watchlist, but here it shows up as single-day anomalies. Fastly (FSLY), Rubrik (RBRK), Samsara (IOT), Maximus (MMS), Silicon Labs (SLAB), SITM, NSSC, SNX, SATS, and DXYZ all print multi-sigma days. Several of them finish marginally down on the session, again with modest realized vol, which tells you these were big inventory transfers rather than breakouts. In other words, the marginal buyer and seller agreed on price but not on narrative. RBRK in particular is doing double duty, surfacing as both a sustained TRV leader and an outlier, which is exactly what you expect to see when a name graduates from being a quiet accumulation story to an institutional battleground. The same is true of HLN, which appears on both lists as specialty pharma risk gets rotated from weak to strong hands.
Industrials and logistics form the next coherent cluster. Spirit AeroSystems (SPR) sits at the top of the table with a multi-hundred-million-dollar print and a six-plus sigma reading, essentially unchanged on the day. That is not hot money; that is someone moving serious aerospace exposure in size. PSN, ENOV, SAIA, TXT, LSTR, ULS, RRX, SBLK, and EFX extend that pattern into specialty machinery, trucking, freight, and marine shipping. Put together, you have an industrial complex seeing outsized one-day prints with price barely budging, which meshes well with the TRV theme of multi-quarter infrastructure and defense demand. This is what it looks like when structurally important supply-chain names change hands between large holders without dislocating the tape.
Real estate and yield are also doing more work than a surface glance suggests. DBRG logs a nearly 9 percent gain on an almost six-sigma flow, which is the rarer case where outlier size does push price. SPG, FR, NSA, RHP, SLG, and HHH all print elevated activity as well, alongside dividend funds like DVY and HDV and staples names such as VITL and K. That ensemble tells you that investors are selectively re-risking into yield and real assets where balance sheets can withstand the current rate regime. The fact that most of these names move only a few tenths of a percent, despite multi-sigma flows, implies there is still plenty of two-sided interest; buyers are aggressive, but sellers are not being forced.
Healthcare continues to split neatly between defensive cash-generators and speculative upside. On the defensive side, you have life-science tools such as Thermo Fisher (TMO) and QIAGEN (QGEN), plus big-ticket biotech GILD, all trading outlier size with almost no price change. On the speculative side, TERN, KRYS, PTGX, ADPT, ONC, and RPRX print multi-sigma days with higher realized vol, particularly TERN and ADPT where both flow and percentage move are meaningful. This reinforces the idea that healthcare is functioning both as a ballast sleeve and as an option on idiosyncratic science, a dual role that fits the broader risk-on but sophisticated tone of institutional positioning.
Energy and materials outliers paint a picture of active but nuanced commodity risk. Range Resources (RRC), Valvoline (VVV), uranium proxy CCJ, steel names like NUE and TECK, gold-adjacent AU and MYE, and the gas complex via FCG, UNG, and the levered inverse KOLD all show abnormal flows. Here, unlike the index complex, percent moves are more noticeable and realized vol often sits in the 0.3 to 0.7 range or higher. Coupled with the presence of both long and short natural gas vehicles on the list, that points to energy being traded as a tactical macro tape, with institutions leaning into relative value and curve positioning rather than a monolithic bullish or bearish call.
Consumer exposure on the IO sheet is nuanced and consistent with what we saw in the TRV and sector work. Discretionary names like CHH, DG, VSCO, CPNG, DKNG, STLA, and ZUMZ all show up, but the flows are mixed. DKNG wears a high sigma tag with a single-day drawdown north of 3 percent, suggesting de-risking in specific high-beta consumer stories, while ZUMZ, VSCO, and CPNG see outlier activity with modest positive price action. Layer in food and staples such as VITL and K and you get a picture of a consumer complex being sorted rather than traded as a one-directional macro bet: capital is pressing into where the unit economics look durable and backing away from the frothier edges.
Financials round out the picture in a way that echoes the TRV themes almost perfectly. Insurance names WRB, CB, MCY, TRUP, and sector ETF IYF register as outliers along with banks KEY, TD, KB, and CASH, plus capital-markets plays HLNE and SPGI. KEY is particularly interesting as it crosses over from the TRV portfolio into the IO list with a nearly 1 percent down day on big flow, which smells more like profit-taking after a strong run than a fresh panic. Meanwhile, the broad financial ETFs IYF and IYG handle large blocks with price almost unchanged. Taken together, this suggests that the market still views financials as a functioning, allocatable sector, not a source of hidden systemic stress.
If the TRV leaderboard told us where interest has been quietly building, the IO sheet shows where that interest erupted into statistically abnormal prints. The overlap between the two – RBRK, HLN, HHH, KEY and others – is where the tape is telling you to pay the closest attention. Those are the names and sleeves where sustained institutional curiosity has now been validated by outlier-scale execution. This is still a market dominated by disciplined index allocation, with serious size being put to work in software, industrial infrastructure, hard assets, and carefully selected healthcare and consumer names, while energy and EM are traded tactically around the edges.
VL Consensus Prices™
These are the most frequently traded #1-Ranked Levels in VL this week. Trades occurring at the highest volume price in a ticker’s history are significant because they represent institutional engagement at a key price memory level—where the market once found consensus. These areas act as liquidity hubs, enabling large players to transact efficiently, and often signal a reassessment of fair value. This activity may precede major moves, mark equilibrium zones, or reflect broader portfolio shifts, making these price levels important to watch even without yet knowing how price will resolve. (Note: many Bond products trade in such a tight range that they dominate the top positions and are therefore omitted to provide better clarity around other flows. The bonds data is still available in the VL platform.)
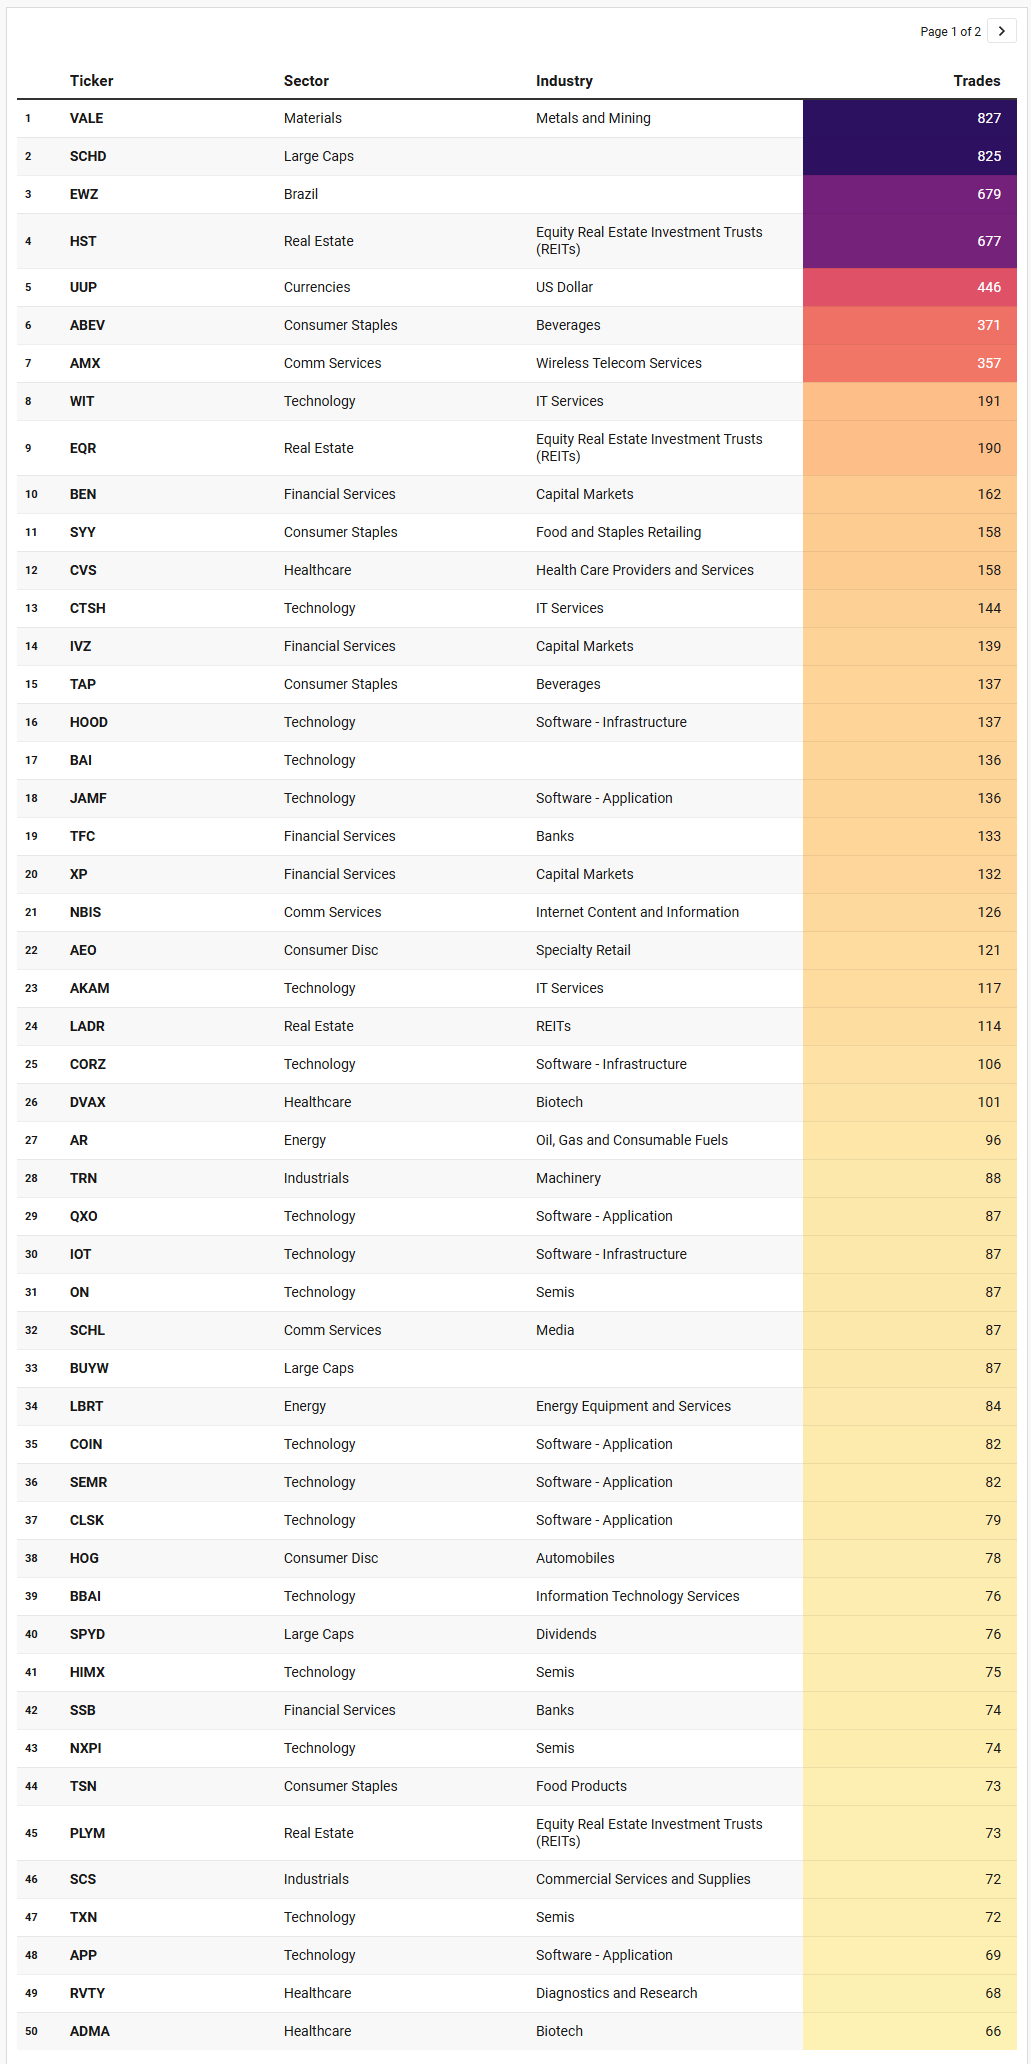
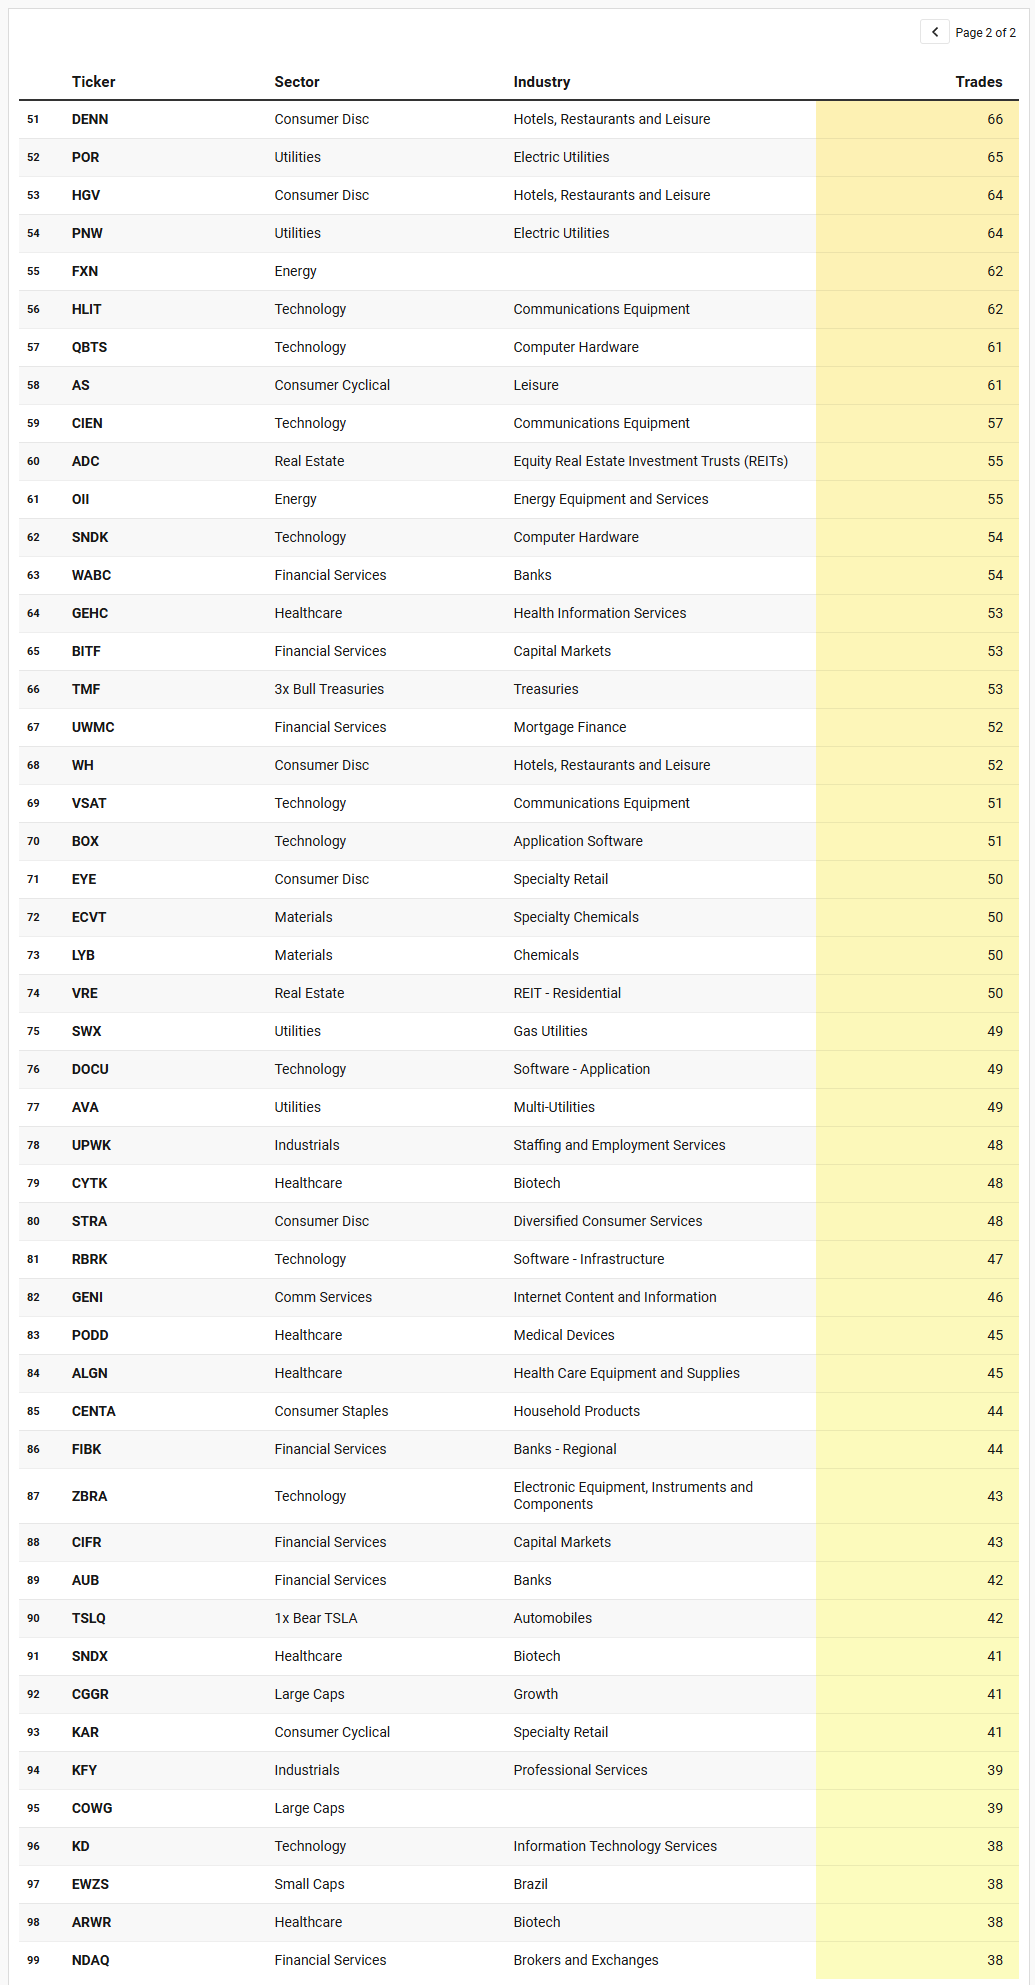
On the consensus list, what we are really seeing is where the market has decided, “this is fair value for now” and voted with record volume at that band. When you line these names up against the TRV and IO lists, the overlaps are hard to miss: institutions are hammering out reference levels in the same places they have been quietly accumulating and transferring risk for weeks.
First, there is a very clear “core plus yield” backbone. SCHD and SPYD both show up with record-by-price activity, alongside large-cap wrappers like BUYW, CGGR and COWG. That is the same dividend / quality complex we built directly into the portfolio, now confirmed by the fact that more shares traded at these exact levels than at any other price in their history. Add in UUP and TMF and you get the shape of the hedge book: long high-quality equity income and large caps, with consensus levels in a strong-dollar vehicle and a 3x Treasury bull. That combination fits neatly with the earlier read that big accounts are staying allocated to equities but want optionality if rates or FX wobble; they are crystallizing “lines in the sand” in both the cash-equity and macro-hedge sleeves.
Real assets and defensives are the next obvious cluster. VALE sits at the top of the list with the most trades, joined by EWZ, EWZS, HST, EQR, PLYM, ADC, VRE, and materials names like ECVT and LYB. That is Brazil, metals, and U.S. REITs all punching out consensus levels together. ABEV and TSN give you beverages and food products, SYY and CENTA add food distribution and household goods. Put together, it looks like a market that is very actively re-basing its view on hard assets and cashflow-heavy defensives: where do we want to own Brazilian beta and commodity-exposed balance sheets, and at what cap rates and yields are REITs “good enough” in the current rate environment. The fact that several of these – VALE, EWZ, HST, EQR, VRE – also appear elsewhere in our flow work tells you this is not random noise; institutions are repeatedly engaging these tickers at the same zones until a new equilibrium prints.
Technology and digital infrastructure are everywhere on the sheet, and the mix is instructive. You have IT services and infra like WIT, CTSH, AKAM, BBAI, KD and ZBRA; software platforms such as HOOD, JAMF, QXO, COIN, SEMR, CLSK, APP, DOCU, BOX and CORZ; communications and networking via HLIT, CIEN, VSAT; and semis including ON, NXPI, TXN, HIMX and QBTS. Some of these, notably CORZ, NXPI, WIT, FIBK, RBRK and ZBRA, have already shown up as TRV leaders or IO outliers. That kind of cross-pollination is exactly what you expect when a theme is moving from “interesting idea” to “institutional consensus.” Record volume-by-price in these tickers tells you that the street is actively negotiating what it wants to pay for the rails of the digital economy – cloud, security, AI-adjacent semis, retail trading infrastructure and even the crypto on-ramps via COIN, CLSK, BITF and CIFR. It is not a one-way chase; it is a very busy handshake around new reference levels.
Financials and real-economy cyclicals round out the picture in a way that dovetails with the portfolio construction. Capital-markets and asset-management names such as BEN, IVZ, XP, BITF, CIFR and NDAQ are printing their heaviest-ever consensus levels at the same time regional and consumer banks like TFC, SSB, WABC, FIBK and AUB are doing the same. UWMC brings in mortgage finance. The market is effectively repricing the plumbing of the financial system: what are these fee streams and loan books worth if the rate path is shallower and volatility persists. On the cyclical side, autos and travel/leisure – HOG, TSLQ, DENN, HGV, WH, AS – along with industrials like TRN, SCS, KFY and staffing proxy UPWK, all show that institutions are very active in the “real economy” sleeves, but doing it at carefully negotiated levels. There is no sign here of indiscriminate dumping or euphoria; there is a lot of volume crossing hands at prices both sides can live with.
Energy, utilities and staples link back to the inflation and macro-hedge thread we have been tracking. AR, LBRT, FXN and OII cover upstream and services, while POR, PNW, SWX and AVA pin consensus levels across regulated electric and gas utilities. ABEV, TAP, SYY, TSN and CENTA give you beverages, food and household products. When you see record-by-price volume in both the commodity-sensitive producers and the regulated, rate-sensitive utilities, it usually means institutions are refreshing their views on how sticky input costs and policy are going to be, and they want their exposure calibrated accordingly rather than dialed to zero. UUP and TMF on the same list reinforce the idea that this recalibration is happening in a macro-aware way, not in isolation.
Finally, a number of names act as bridges across our different watchlists and sleeves. CORZ and FIBK are in the portfolio and appear here at consensus levels. WIT, NXPI, ZBRA, RBRK and IOT show up across TRV, IO and now consensus, suggesting that software, semis and select IT services remain the beating heart of institutional risk-taking. EWZ and HST, which we have already seen as outlier and sector-flow stories, are once again highlighted as places where enormous amounts of risk have agreed on a price. When the same tickers keep surfacing as sustained interest, one-day anomalies and now record volume-by-price, the tape is giving you a very specific map: these are the battlefields where the next leg of leadership and underperformance is likely to be decided.
In short, the consensus-level list is not a new narrative; it is confirmation. It shows core dividend and large-cap wrappers, hard assets, Brazil, REITs, software infra, semis, and the crypto-adjacent rails all trading at historically important price bands, exactly where we would expect if big money were methodically locking in reference levels while staying fully engaged with risk.
MIR Part 3: Framing-Up A Trade
By the time the TRV leaders, IO outliers, and consensus levels are all laid on top of one another, the message from the tape is no longer subtle. Institutions are not de-risking. They are allocating with intent, but they are doing it with discipline, leverage selectivity, and hedges embedded at the portfolio level rather than through wholesale cash. The core of the book remains anchored in large-cap equity beta and dividend carry. Around that core, risk is being expressed in software infrastructure, semiconductors, selective real assets, and tactical crypto and energy vehicles. At the same time, the presence of UUP, TMF, dividend ETFs, and utilities at consensus levels tells you that protection is being bought not through fear, but through structural ballast.
This is a market that wants to stay long, but not naked. It wants growth, but with cashflow. It wants leverage, but in instruments that can be turned off quickly. And it wants optionality in rates, dollar, and energy without making one-way macro bets. Positioning for the week, then, is not about chasing the last candle. It is about building a book that mirrors how institutions are actually deploying capital: a core risk engine with modular tactical overlays and built-in shock absorbers.
***Core Equity Beta and Dividend Carry – 35%
This is the balance sheet of the portfolio. These are the positions that express the market’s primary direction and generate carry while the rest of the book takes selective risk.
VOO 10%
IVV 8%
SCHD 9%
SPYD 8%
VOO and IVV express clean large-cap beta, which remains the dominant liquidity sink on the institutional tape. SCHD and SPYD anchor the income and quality factor, both of which just printed consensus levels on record volume. This sleeve benefits if the market grinds higher and cushions volatility if markets stall.
***Technology and Digital Infrastructure – 22%
This is the growth engine and the thematic heart of the current regime. It reflects both sustained accumulation in the TRV list and heavy consensus engagement across software, infra, and semis.
NXPI 6%
ZBRA 5%
RBRK 5%
SOXQ 6%
NXPI and ZBRA represent semiconductors and industrial digitalization that sit downstream from AI and automation capex. RBRK is the software infrastructure expression that has now appeared across every flow lens. SOXQ keeps the exposure broad and liquid while retaining convexity to continued semiconductor leadership.
***Tactical Leverage and Thematic Convexity – 10%
This sleeve expresses institutional appetite for leverage in a controlled way. It is where desks press when the tape confirms short-cycle momentum.
NVDU 4%
MSFU 3%
PTIR 3%
These are not strategic holdings. They are acceleration tools. Their presence in TRV alongside sustained megacap engagement confirms that institutions are comfortable scaling exposure through embedded leverage when trend and liquidity align.
***Real Assets, Energy, and Materials – 12%
This sleeve reflects the constant bid in hard assets, Brazil, and inflation-sensitive supply chains that has now printed consensus levels at scale.
VALE 4%
EWZ 3%
LEU 3%
SGML 2%
VALE and EWZ anchor emerging-market materials and Brazilian commodity beta right at historically important price levels. LEU and SGML express the uranium and industrial-metals backbone tied to energy transition, defense, and electrification.
***Industrials and Infrastructure – 8%
This is the real-economy growth sleeve tied to logistics, specialty manufacturing, and defense-adjacent buildout.
HXL 3%
SITE 3%
MYRG 2%
All three names have shown sustained or anomalous institutional interest and map cleanly to multi-quarter capex and infrastructure demand rather than cyclical noise.
***Healthcare Optionality – 6%
This sleeve captures the speculative upside institutions continue to fund in biotech without letting it dominate portfolio risk.
OLMA 2%
VOR 2%
MIRM 2%
These are not defensive healthcare allocations. They are optionality on science, consistent with the tape’s risk-seeking healthcare behavior.
***Financials and Capital Markets – 4%
This sleeve reflects confidence in transactional and capital-markets throughput rather than balance-sheet stress.
KEY 2%
IBKR 2%
KEY has shown up across portfolio, TRV, and IO flows, while IBKR expresses rising trading activity and participation.
***Crypto and Digital Assets – 3%
This is the volatility sleeve. It is designed for tactical exposure, not ideological ownership.
BITU 2%
ETHW 1%
These positions gain from short-cycle momentum and volatility without forcing directional commitment if the regime fractures.
***Macro Hedges and Shock Absorbers – 10%
This sleeve exists so the rest of the portfolio can stay long without being fragile.
TMF 4%
UUP 3%
SPSB 3%
TMF protects against a sharp risk-off or growth scare via duration convexity. UUP offers dollar upside in any global stress. SPSB dampens credit volatility and smooths portfolio carry.
Total Portfolio: 100%Putting it all together, this is a balanced offensive posture. Roughly two-thirds of the book is directly exposed to equities, with the highest weights in large-cap beta, dividends, and technology. One-third is split between tactical leverage, real assets, healthcare optionality, and hard macro protection. This is exactly how the institutional tape looks right now: long, but layered. Constructive, but hedged. Confident enough to use leverage, disciplined enough to hold ballast.
From a tactical standpoint, the playbook for the week is straightforward. As long as large-cap ETFs continue to absorb size without price damage, the core remains intact. Continued strength in software infrastructure and semis justifies keeping the growth sleeve fully allocated. A rollover in BITU or NVDU without corresponding weakness in IVV and VOO would be a cue to trim convexity without changing the strategic posture. Conversely, renewed expansion in VALE, EWZ, and NXPI alongside flat TMF would confirm that the rotation into real assets and digital buildout remains in force.
In practical terms, if the tape turns and we need to trim-up a bit, the trim sequence would look like this: first, flatten leverage and crypto. Second, cut biotech optionality. Third, lighten cyclicals and secondary growth. Only if downside becomes persistent do you begin reshaping core technology and beta. The income and hedge sleeve remains intact until the tape proves that capital preservation has become the dominant objective. Bottom line: if the tape goes south, you do not debate, you de-lever first, de-speculate second, de-cycle third, and only then touch the core.
Good luck this week VL!

Thank you for being part of our community and for dedicating your time to this edition. Your insights and engagement drive everything we do, and we’re honored to share this space with such committed, thoughtful readers. Here’s to a week filled with clear opportunities and strong performance 💰💰💰
VolumeLeaders