

Market Momentum: Your Weekly Financial Forecast & Market Prep
Issue 74 / What to expect Jan 05, 2026 thru Jan 09, 2026

NOTE: This weekly periodical is too large for Substack to deliver in its entirety via email - you will only see a portion of this great content if you read from your email client. Click the VOLUMELEADERS logo above to read the full article!
In This Issue
Weekly Market-On-Close Report: All the macro moves, market drivers, and must-know narratives—covered in less than five minutes.
Weekly Benchmark Breakdown: Our weekly intelligence report on major indices cuts through the index-level noise to uncover participation, momentum, and structural integrity and tell you whether markets are rising on solid ground or skating on thin breadth. This is where bull markets prove themselves—or quietly start to unravel.
The Latest Investor Sentiment Readings: Track the emotional pulse of the market with our curated dashboard of sentiment indicators. From fear-fueled flight to euphoric overreach, this week's readings reveal whether investors are cautiously creeping in—or stampeding toward the exits.
Institutional Support & Resistance Levels For Major Indices: Exactly where to look for support and resistance this coming week in SPY, QQQ, IWM & DIA
Normalized Performance By Thematics YTD: Which corners of the markets are beating benchmarks, which are overlooked and which ones are over-crowded!
Key Econ Events & Earnings On-Deck For This Coming Week

Weekly Market-On-Close Report
Market On Close: Turning the Page Into 2026
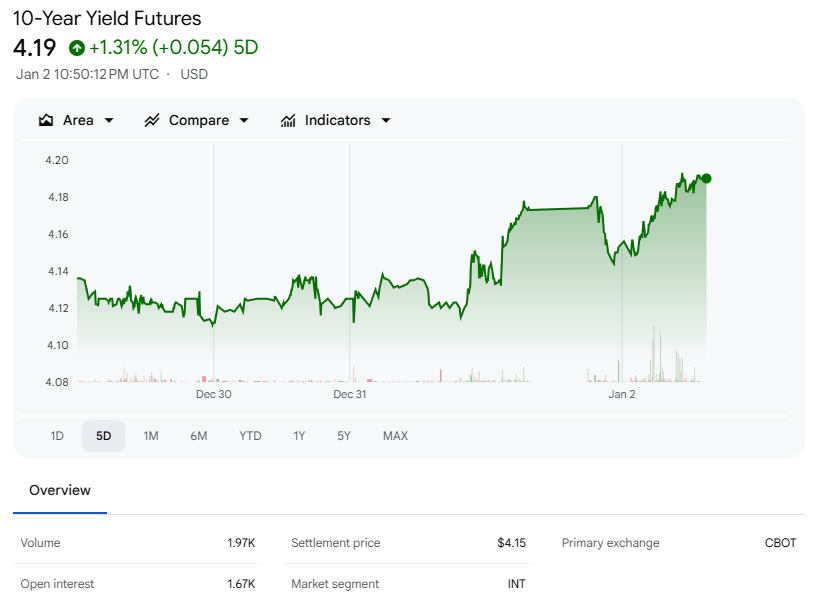
U.S. equity markets closed the final session of 2025 on a mixed note, a fitting end to a year defined by rotation, resilience, and repeated tests of conviction. Beneath those surface-level moves, the internal story was more nuanced. The S&P 500 and Dow recovered from two-week lows, supported by renewed strength in semiconductor and AI infrastructure stocks. That strength, however, was selective. Megacap technology weighed on the Nasdaq 100, pulling it to a two-week low, while weakness in cybersecurity and insurance stocks capped broader market upside. Adding to the headwinds, higher bond yields exerted pressure on equity valuations, with the 10-year Treasury yield rising to a one-and-a-half-week high of 4.19%.
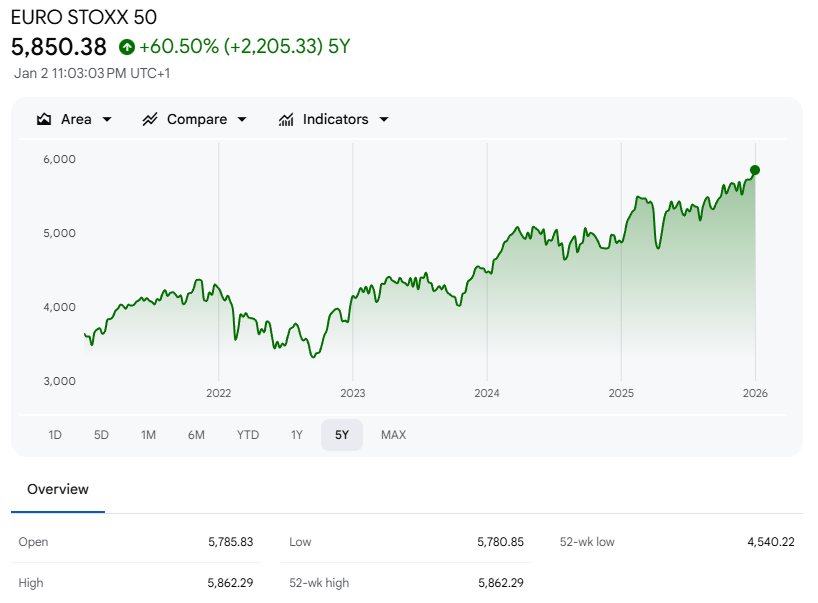
Global markets provided an offset. European equities were notably strong, with the Euro Stoxx 50 surging 1.02% to a new all-time high. That momentum carried over into U.S. trading, reinforcing the sense that global risk appetite remains intact even as U.S. markets digest elevated valuations and tightening financial conditions. In Asia, both China’s Shanghai Composite and Japan’s Nikkei Stock Average were closed for New Year’s holidays, muting regional signals.
Economic data during the session were uneventful but steady. The December U.S. S&P manufacturing PMI was unrevised at 51.8, exactly in line with expectations, reinforcing the narrative of modest expansion without acceleration. Markets continue to assign only a 15% probability to a 25-basis-point rate cut at the Federal Open Market Committee’s January 27–28 meeting, suggesting policy expectations remain anchored near current levels.
Rates, Inflation Expectations, and Global Bonds
In fixed income, price action leaned defensive. March 10-year Treasury note futures (ZNH6) fell 7.5 ticks on Friday, pushing the 10-year yield up 2.0 basis points to 4.187%. Yields briefly touched a one-and-a-half-week high of 4.195% as inflation expectations firmed. The 10-year breakeven inflation rate climbed to 2.264%, its highest level in two and a half weeks, reflecting renewed sensitivity to price pressures rather than growth fears.
European sovereign bonds echoed the move. The 10-year German bund yield rose to a one-and-a-half-week high of 2.910%, finishing the session at 2.900%, up 4.5 basis points. In the U.K., the 10-year gilt yield climbed 5.8 basis points to a one-and-a-half-week high of 4.537%. The pressure on global bonds weighed on U.S. Treasuries, underscoring the increasingly global nature of yield dynamics.
Macro data from Europe added complexity. The Eurozone December S&P manufacturing PMI was revised down by 0.4 points to 48.4 from the previously reported 49.2, keeping the region firmly in contraction territory. At the same time, Eurozone M3 money supply growth accelerated to 3.0% year over year in November, exceeding expectations of 2.7% and marking the fastest pace in four months. In the U.K., December manufacturing PMI was revised lower by 0.6 points to 50.6, down from 51.2. Despite these mixed signals, swaps markets price only a 1% chance of a 25-basis-point rate hike at the European Central Bank’s February 5 meeting.
A Holiday-Shortened Week With Telling Signals
The final trading week of 2025 was shortened by the New Year’s Day holiday, and volumes reflected that reality. U.S. markets were closed Thursday, and trading activity remained light throughout much of the week. Even so, performance dispersion offered clues about underlying positioning.
All major U.S. equity indexes declined on the week, with the Nasdaq Composite leading to the downside, followed by the Russell 2000 and the S&P 500. The Dow Jones Industrial Average and the S&P MidCap 400 Index proved more resilient but still fell 0.67% and 0.71%, respectively. Within the S&P 500, energy was one of the few sectors to post positive returns, supported by elevated geopolitical tensions that pushed oil prices higher early in the week.
By the numbers, markets closed out the year with the Dow at 48,110, down 352 points, the S&P 500 at 6,835, down 71 points, and the Russell 2000 at 2,501, down 19 points. NYSE FANG+ ended at 15,592, down 366 points. Commodities were mixed, with ICE Brent crude at $60.20 per barrel, down $1.29, gold at $4,335 per ounce, down $9, and Bitcoin near $89,300, up approximately $2,044.
Housing, Labor, and the Consumer Pulse
Early in the week, housing data delivered a rare upside surprise. The National Association of Realtors reported that its Pending Home Sales Index rose 3.3% in November, the largest month-over-month increase since February 2023. According to NAR Chief Economist Lawrence Yun, improving affordability driven by lower mortgage rates and wage growth outpacing home prices is encouraging buyers to re-engage with the market.
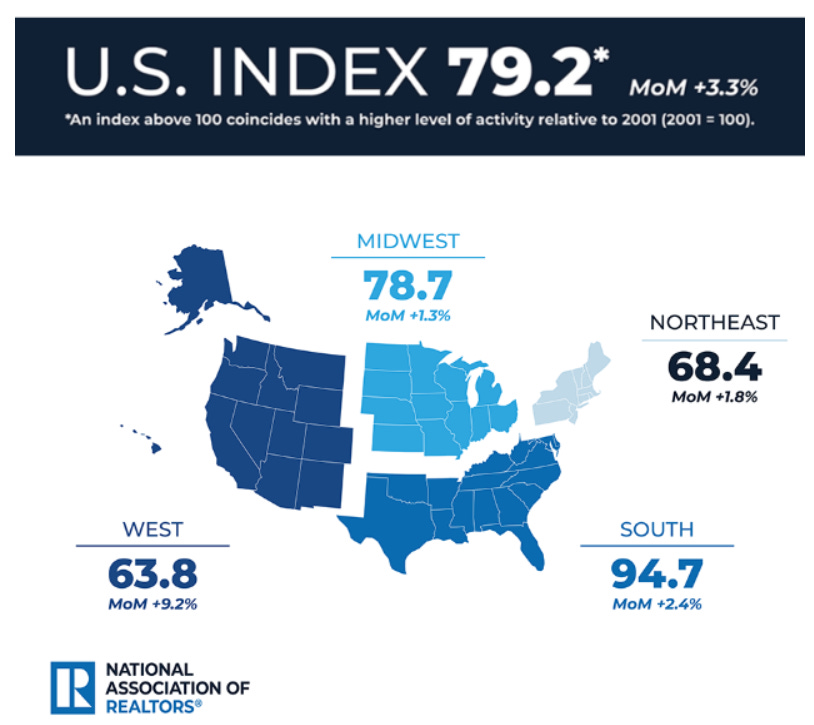
Supporting that view, the Federal Housing Finance Agency reported that U.S. house prices rose 0.4% month over month in October after declining in the prior month. On a year-over-year basis, prices were up 1.7%, with the Middle Atlantic and East North Central regions leading gains.
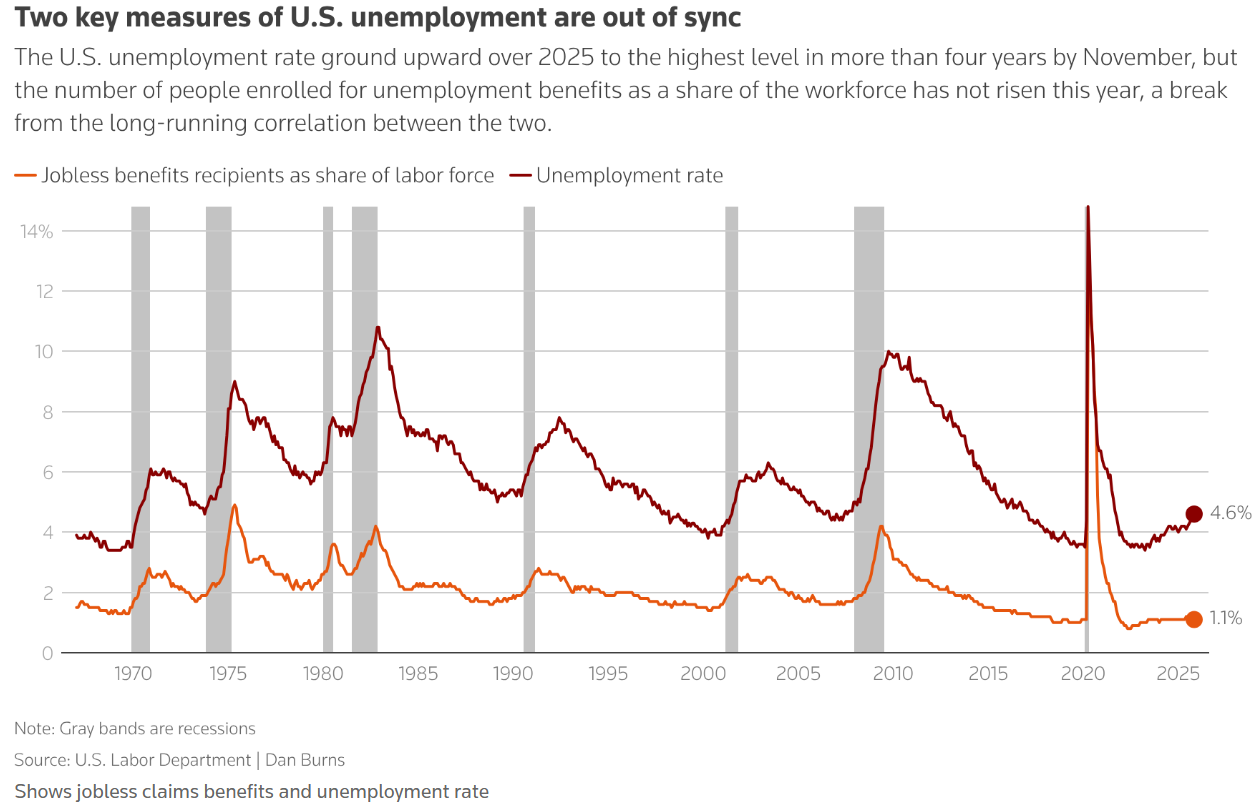
Labor market data continued to suggest resilience rather than deterioration. Weekly jobless claims for the period ending December 27 fell to 199,000, down 16,000 from the prior week and one of the lowest readings of the year. Continuing claims also declined, dropping to 1.866 million from 1.913 million. This marked the third consecutive week of improvement, reinforcing the view that labor market cooling remains gradual rather than abrupt.
Fed Policy, Divisions, and Market Expectations
On Tuesday, the Federal Reserve released minutes from its December 9–10 meeting, where policymakers voted to cut the federal funds rate by 25 basis points. The minutes highlighted a clear division within the Committee. While most participants believe further cuts would be appropriate if inflation continues to decline, some argued that economic conditions may warrant holding rates steady for an extended period following the December move.
Markets reacted calmly. Equity indexes finished modestly lower on the day, and expectations for a January cut remained anchored around 15%, roughly unchanged from the prior week. The message was not one of urgency but of conditional patience.
Credit Markets and Risk Appetite
Credit markets painted a familiar picture. Investment-grade corporate bonds posted negative returns, while high yield bonds outperformed, aided by significantly below-average trading volumes. Municipal bonds lagged Treasuries modestly, with limited activity in both primary and secondary markets. The divergence between investment-grade and high yield reflects continued confidence in economic durability, even as longer-term rates drift higher.
Reflecting on 2025 and Framing 2026
With the calendar turning, it is worth stepping back. Despite a late-year pullback, 2025 was another strong year for equities. The S&P 500 finished up 16.4%, marking the third consecutive year of gains exceeding 15%. After policy-driven volatility early in the year, markets recovered quickly and ground higher through the back half.
Artificial intelligence was once again the dominant theme, but the trade broadened beyond chipmakers to include companies tied to data center construction and energy infrastructure. By the fourth quarter, concerns around the sustainability of capital expenditure levels began to surface, particularly as circular financing arrangements and increased debt issuance attracted scrutiny.

Inflation stabilized but remained above the Federal Reserve’s target. Treasury yields moved lower over the year as the Fed resumed its easing cycle in response to signs of labor market softening. President Trump is expected to announce a replacement for Fed Chair Jerome Powell, inheriting a divided Committee at a pivotal moment for policy direction.
The easing cycle and AI-related uncertainty contributed to rotation into small- and mid-cap stocks and more cyclical areas late in the year. Whether that broadening persists is one of the defining questions for 2026.
As the year opens, four themes stand out. First, assessing the true health of the U.S. economy will be critical as data distortions from last year’s government shutdown fade. Second, with interest rates down roughly 175 basis points from their 2024 peak, the opportunity cost of holding cash is rising. Third, diversification looks increasingly attractive as earnings growth broadens beyond megacap technology. Finally, history suggests that allowing political noise to dictate investment decisions is rarely rewarded, particularly in a midterm election year.
Growth remains positive but uneven. Inflation is contained but not conquered. Policy is easing but cautious. Markets are resilient but selective. The task for investors is not to predict a clean narrative, but to stay adaptive as data, policy, and positioning interact in real time. The year ahead will not be defined by a single theme, but by how well markets navigate these crosscurrents without losing their footing.
Weekly Benchmark Breakdown
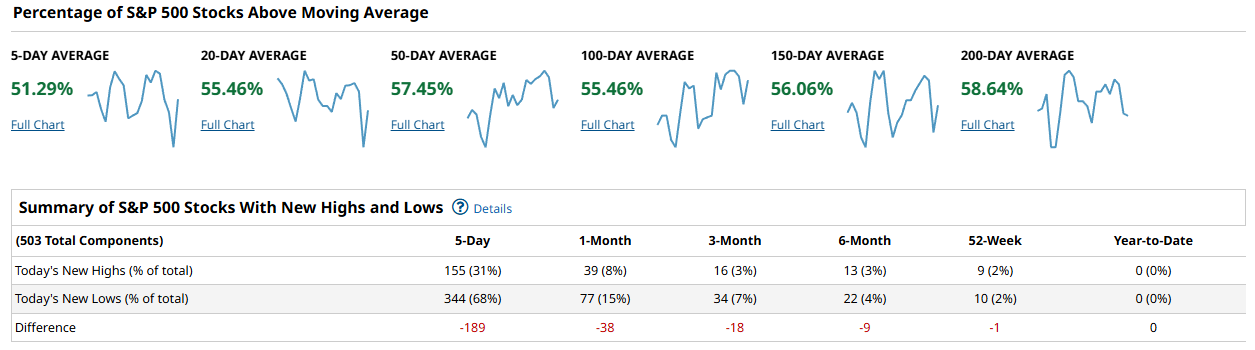
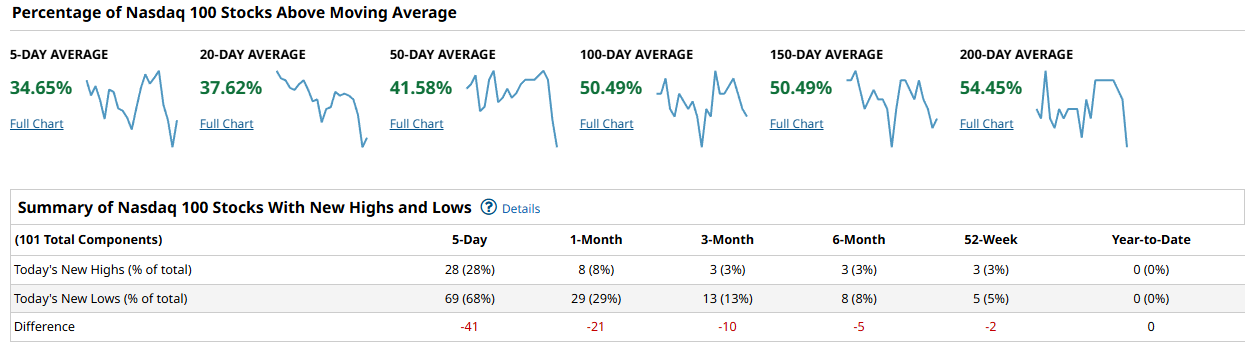
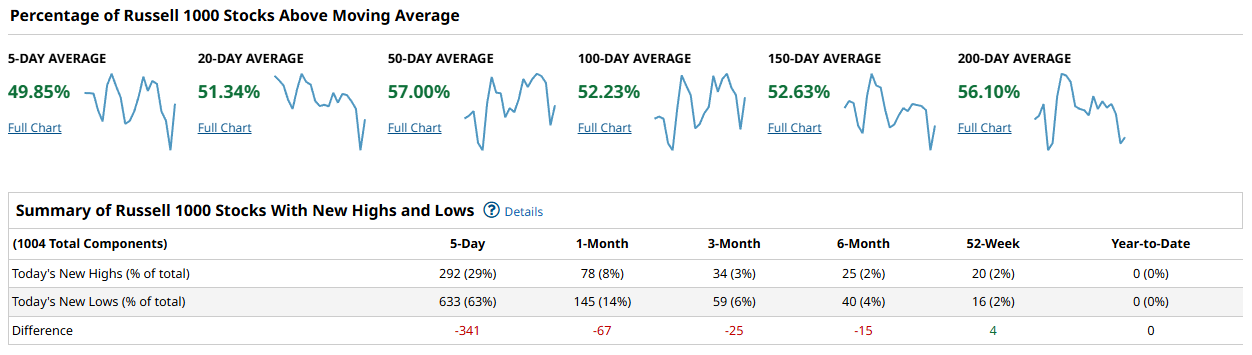
This week was defined by a familiar tension: the long-term trend still has a backbone, but the short-term thrust has softened enough to change the day-to-day risk tone. Across the major universes, the fastest moving-average cohorts are sitting in the 30s to low-50s, while the slower cohorts mostly remain in the low-to-upper 50s. That is not a picture of a market in full retreat, but it is a market where participation is not pressing its advantage. The most telling tell is the new-high/new-low spread: over the last five days, new lows are dominating new highs in every snapshot here, which keeps the tape vulnerable to air pockets and failed breakouts.
For the S&P 500, participation is basically middling and uneven across timeframes. You have 51.29% of constituents above the 5-day, 55.46% above the 20-day, and 57.45% above the 50-day, but the intermediate cohorts are not meaningfully better at 55.46% above the 100-day and 56.06% above the 150-day, with 58.64% above the 200-day. That is more “holding range and trend support” than “broad-based expansion.” The confirmation issue shows up in the highs and lows table: over the 5-day lookback there are 155 new highs versus 344 new lows, a -189 spread. Even on the 1-month horizon it is 39 highs versus 77 lows (-38), and on 3-month it is 16 versus 34 (-18). When the S&P is near the middle of the pack on the moving averages but deeply negative on highs minus lows, it usually means leadership is being carried by fewer names while the average stock is grinding or leaking.
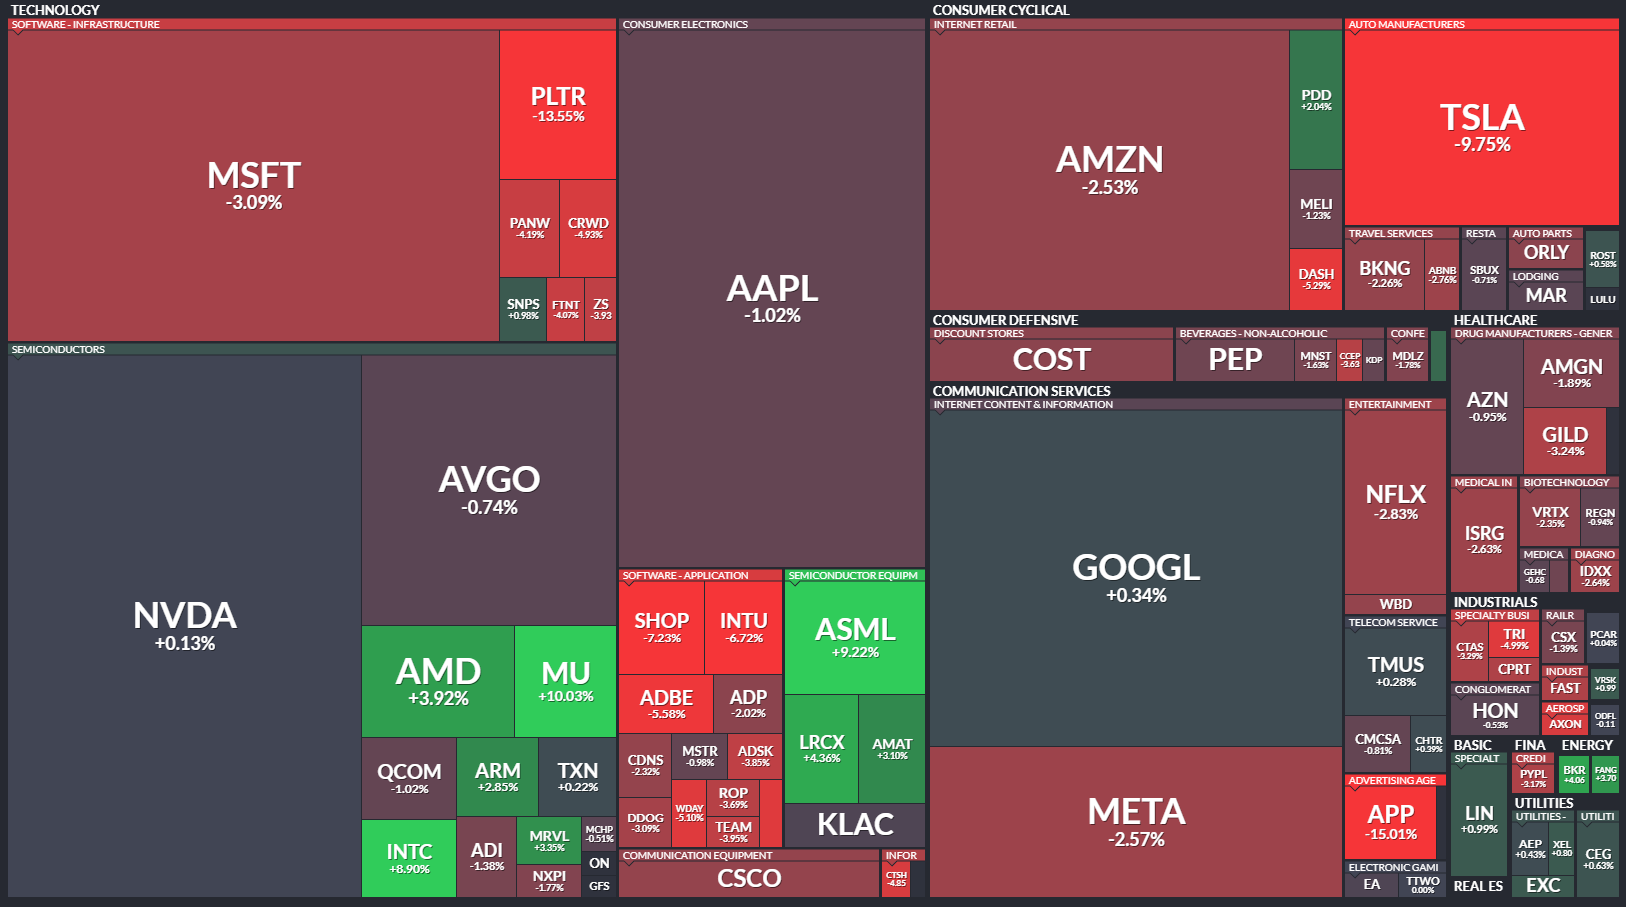
The Nasdaq 100 is the clearest soft spot. Only 34.65% are above the 5-day and 37.62% above the 20-day, with 41.58% above the 50-day. Yet the longer-term measures still look passable: 50.49% above the 100-day, 50.49% above the 150-day, and 54.45% above the 200-day. That is the classic profile of a growth-heavy index going through a short-term derating while the primary trend hasn’t fully cracked. The internal damage, again, is in the highs and lows: 28 new highs versus 69 new lows over 5 days (-41), and 8 versus 29 over 1 month (-21). When the NDX is under 40% on the 20-day cohort and the new lows are running ahead of new highs, rallies tend to be more fragile and more headline-sensitive.
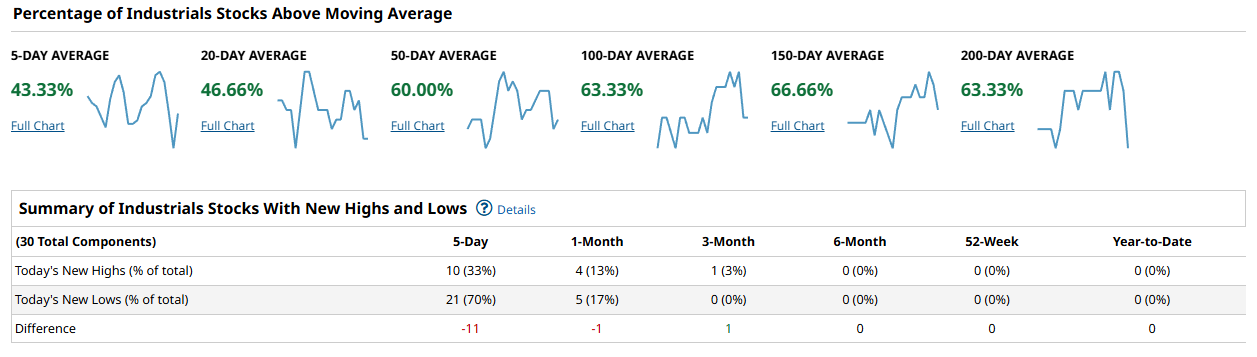
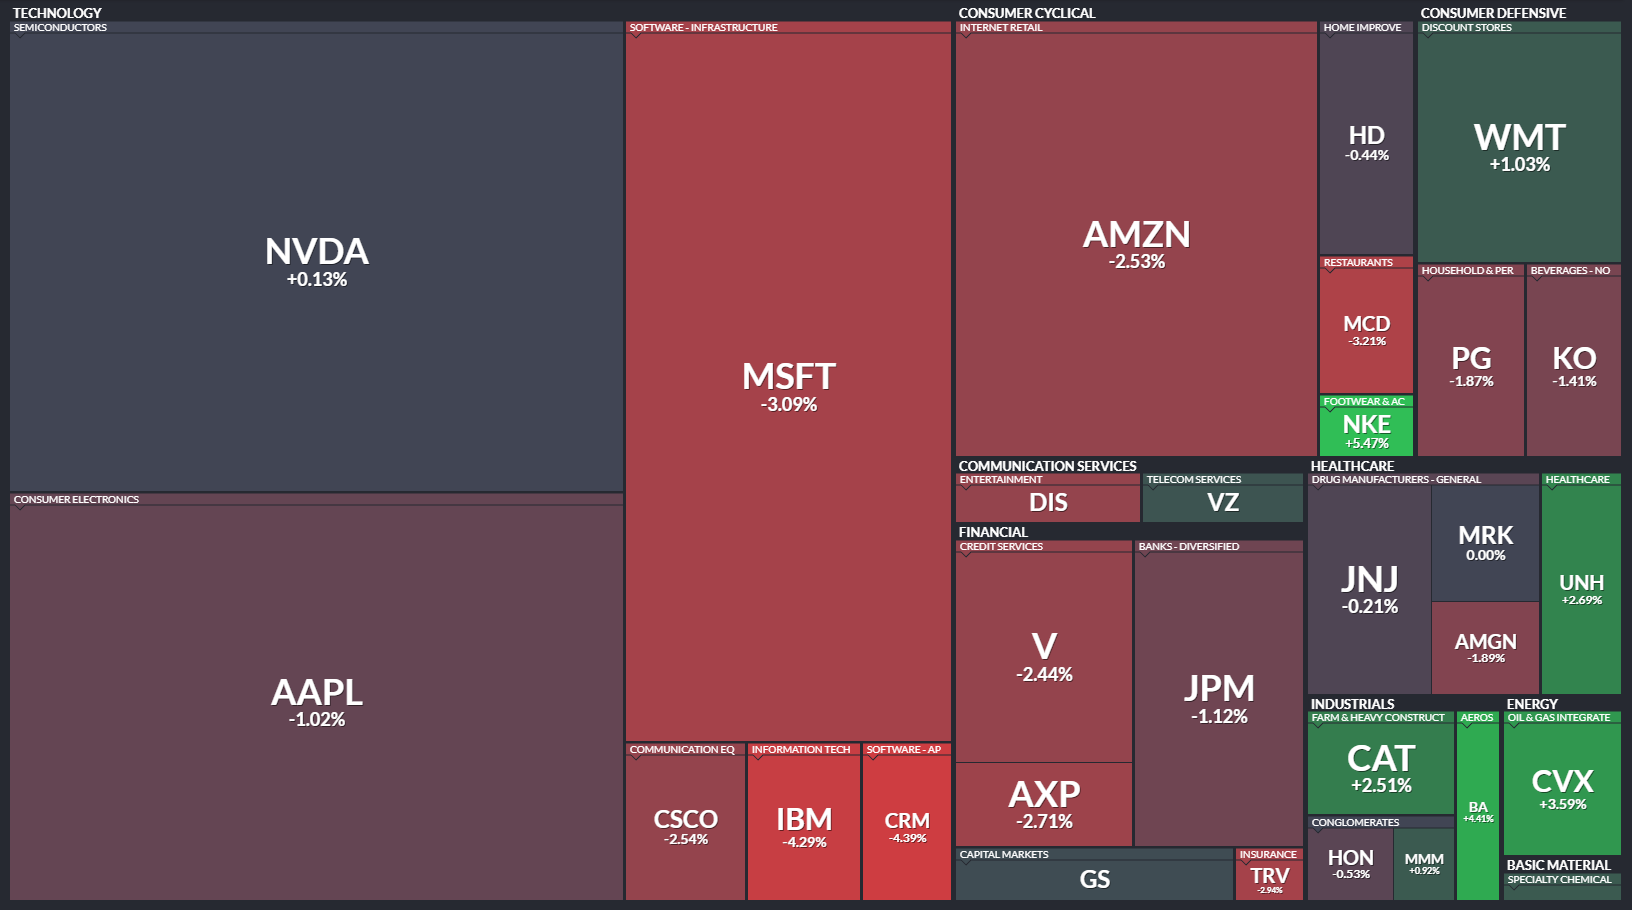
The Dow-industrials snapshot is more resilient on the longer lookbacks, but still not giving you the “everything is working” signature. Only 43.33% are above the 5-day and 46.66% above the 20-day, but 60.00% are above the 50-day, 63.33% above the 100-day, 66.66% above the 150-day, and 63.33% above the 200-day. So the intermediate trend is healthier here than in the Nasdaq, but the near-term participation has cooled. The 5-day highs and lows show 10 new highs versus 21 new lows, an -11 spread, and the 1-month is essentially flat-to-slightly negative at 4 highs versus 5 lows (-1). Notably, the 3-month spread is slightly positive at 1 high versus 0 lows (+1). That combination usually reads as “rotation and digestion,” not collapse, but it also tells you the index is not immune if selling pressure continues to broaden.
The Russell 1000 looks like the S&P with slightly more strain in the highs/lows data. Percent above moving averages sits at 49.85% (5-day), 51.34% (20-day), 57.00% (50-day), 52.23% (100-day), 52.63% (150-day), and 56.10% (200-day). That is broadly sideways participation: not broken, not expanding. The highs and lows skew is heavy on the downside over shorter horizons: 292 new highs versus 633 new lows over 5 days (-341), 78 versus 145 over 1 month (-67), 34 versus 59 over 3 months (-25), and 25 versus 40 over 6 months (-15). The one bright spot is the 52-week column: 20 new highs versus 16 new lows, a +4 spread. That nuance matters. It suggests the market still has a shelf of longer-term winners holding up, but the near-term distribution is overwhelming the day-to-day tape.
Putting it together, this is a cap-weighted, trend-supported market that is not currently enjoying broad participation. The S&P and Russell both hover around the low-to-mid 50s on the 20-day and 100-day cohorts, while the Nasdaq 100 is materially weaker in the short-term cohorts (mid-to-high 30s) and only marginally better than 50% above the 100-day. The Dow looks best on the 50/100/150-day measures, but it is also slipping on the 5/20-day. For a durable advance, you want to see the 50-day cohorts push and hold above 60% across the major universes, and you want new highs to start beating new lows rather than trailing them by dozens (or hundreds). If instead the 20-day cohorts stay stuck near 50% (or below 40% in the Nasdaq) while new lows continue to dominate, that is the setup for choppy trade, failed breakouts, and sudden downdrafts.
The playbook this week is to respect the longer-term trend without paying “trend prices” for short-term uncertainty. Favor areas and styles that are still holding their intermediate moving averages, and be selective with growth exposure while the Nasdaq’s short-term participation is depressed. Avoid chasing strength that is not being confirmed by breadth, and keep a close eye on whether the S&P can lift the 20-day and 50-day participation while shrinking the new-low list. The quickest tell to watch is whether the new lows contract meaningfully while the percent above the 20-day climbs; that combination is how fragile rebounds turn into sustainable ones.
Bottom line: the primary trend is still standing, but the breadth thrust is weak enough that the market remains in a prove-it phase.

Investor Sentiment Report
%Bull-Bear Spread
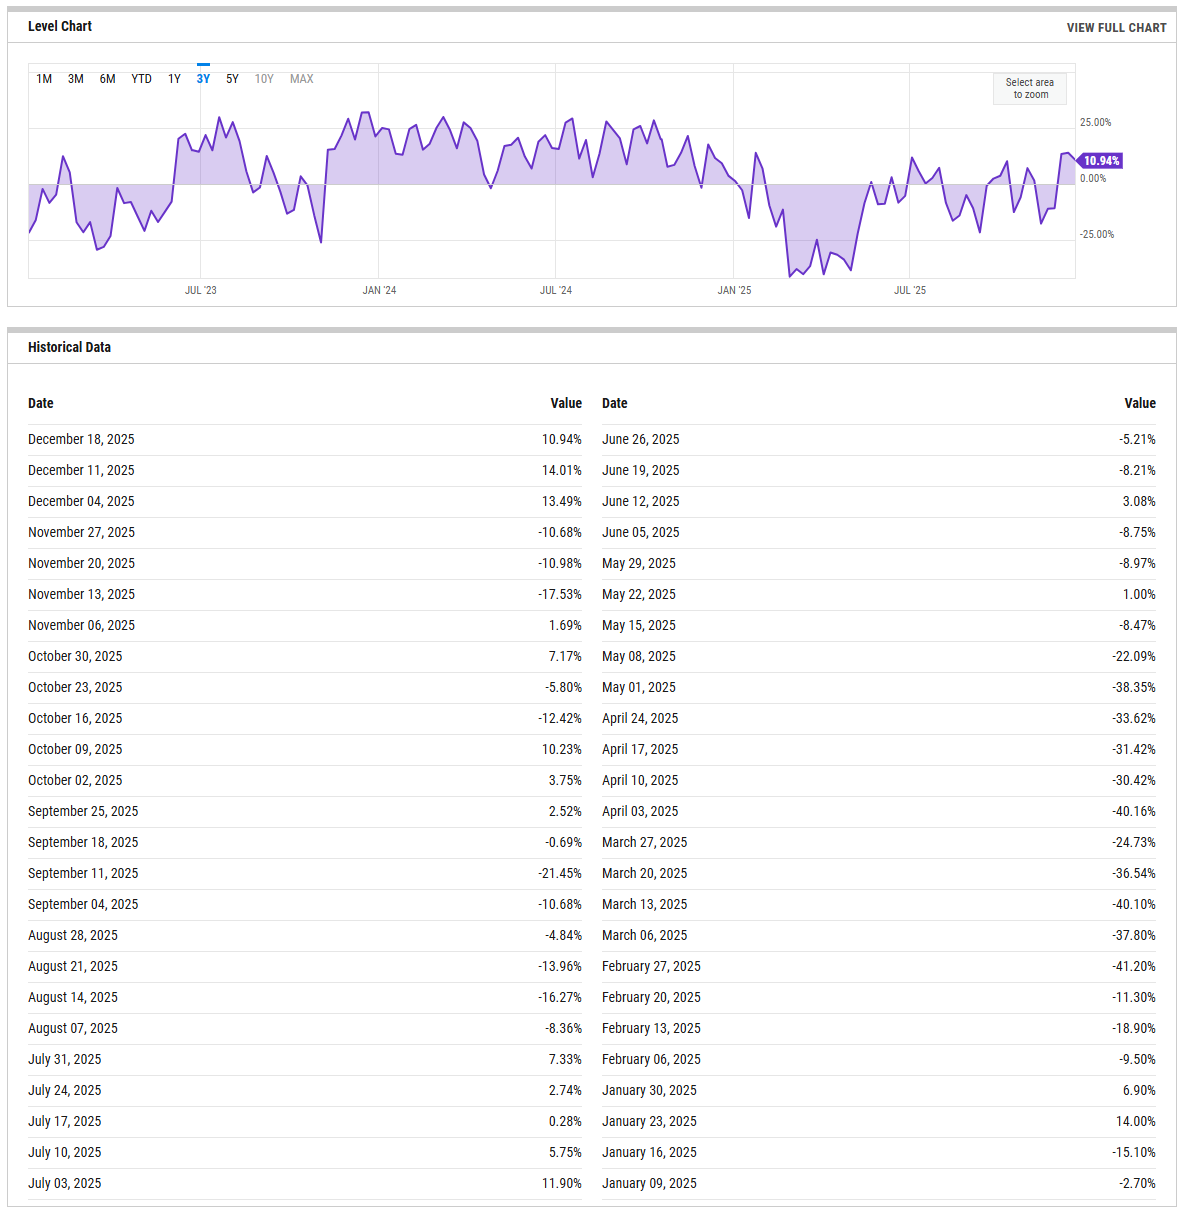
The %Bull-Bear Spread measures the gap between bullish and bearish investor sentiment, often from surveys like AAII. It’s a contrarian indicator—extreme optimism may signal a coming pullback, while extreme pessimism can hint at a potential rally. Large positive or negative spreads often mark market turning points.
The percent bull-minus-bear spread is back on the positive side but not in a “crowded-long” zone. The latest reading is 10.94% (Dec 18, 2025), down from 14.01% the prior week (Dec 11) and 13.49% the week before that (Dec 04). The notable feature is how quickly this series can swing: it was negative in late November (for example, -10.68% on Nov 27 and -10.98% on Nov 20), and it also printed a deeper downtick at -17.53% on Nov 13. In plain terms, positioning pressure has eased from that late-November pessimism, but it is not yet stretched in either direction. Tripwires are straightforward: a drop in the spread back below 0% would put contrarian tailwinds back in play, while a push above 20% would signal a more crowded, fragile consensus.
NAAIM Exposure Index
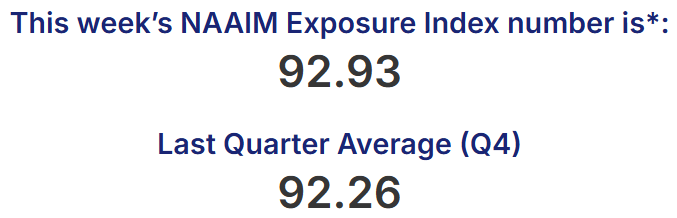
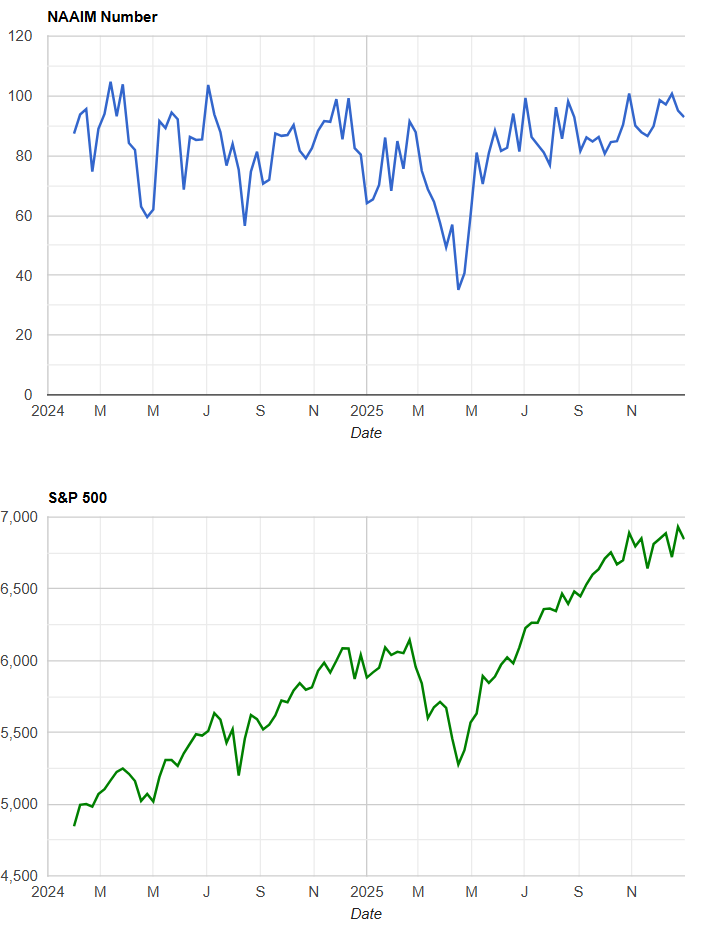
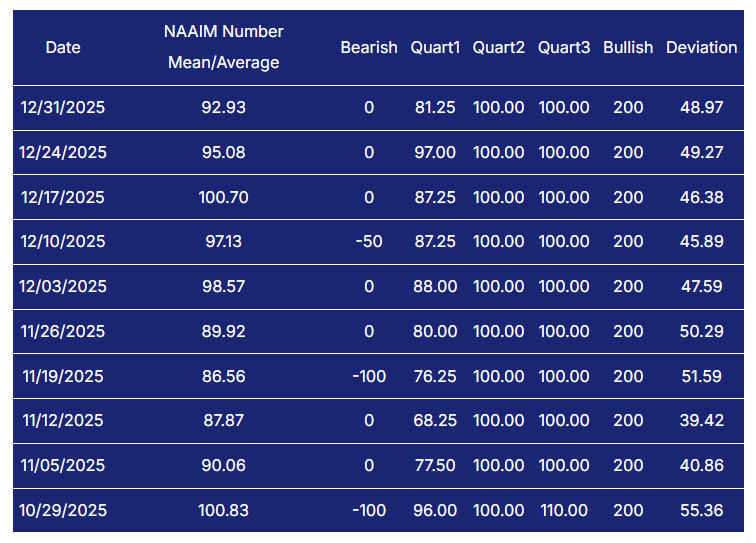
The NAAIM Exposure Index (National Association of Active Investment Managers Exposure Index) measures the average exposure to U.S. equity markets as reported by its member firms. These are typically active money managers who provide their equity exposure levels weekly. The index offers insight into how much these managers are investing in equities at any given time, ranging from being fully short (-100%) to leveraged long (up to +200%).
NAAIM exposure, however, is still very elevated: 92.93 on 12/31, with recent readings at 95.08 (12/24) and 100.70 (12/17). That mix usually means managers remain heavily invested even as the marginal improvement in the bull-bear spread has cooled. Tripwire for NAAIM: a drift down into the 50s without meaningful price damage would be constructive (dry powder), while a renewed push back into the 90s-plus after any dip would raise the odds of a sharper de-risking air pocket.
CBOE Total Put/Call Ratio
CBOE's total put/call ratio includes index options and equity options. It's a popular indicator for market sentiment. A high put/call ratio suggests that the market is overly bearish and stocks might rebound. A low put/call ratio suggests that market exuberance could result in a sharp fall.
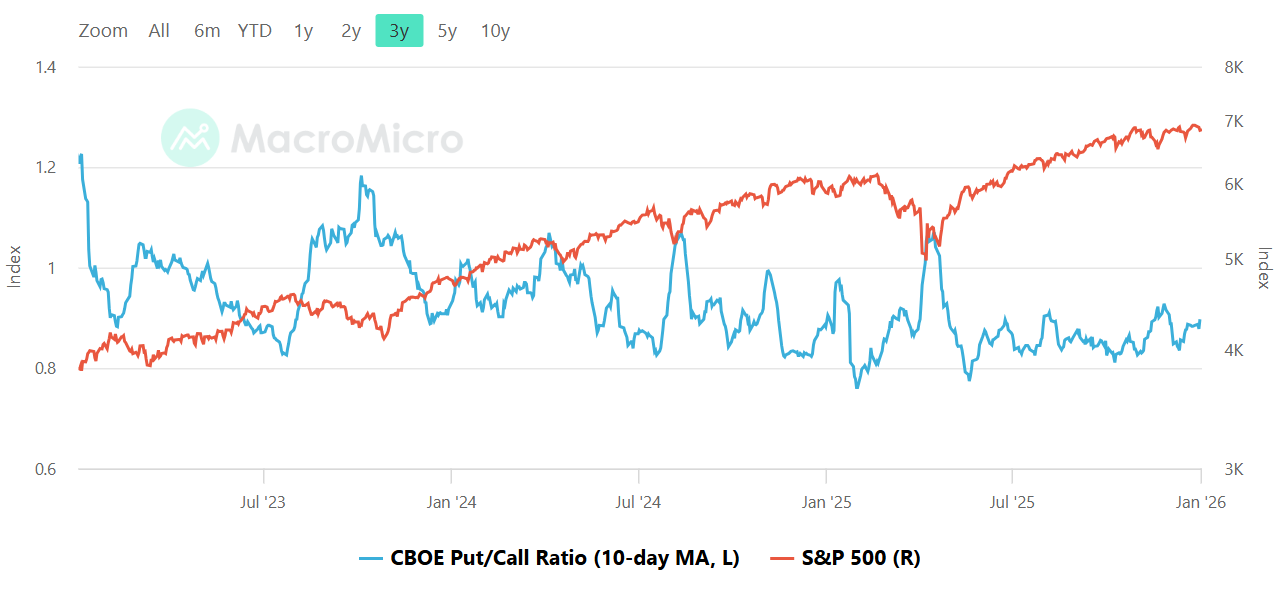
The visible series is the put/call ratio with a 10-day moving average (blue) plotted against the S&P 500 (red). The key observable is regime, not a precise print: the 10-day average is sitting below 1.0 in recent months and has been oscillating in a fairly tight band rather than spiking and staying elevated. That is consistent with a market that is not in panic hedging mode, but also not in the kind of sustained “complacency melt-up” behavior you see when put/call compresses and stays pinned at very low levels. Practically, this tends to cap the depth of drawdowns (less forced hedging feedback) but can also dull the quality of rebounds because fear has not been fully wrung out. The tripwires here are the usual ones: if the 10-day average sinks toward the frothier end of the range (around 0.8 or lower), risk-taking becomes more brittle and pullbacks can get sharper because protection is thin. If it lifts and holds above roughly 1.0, that is fear and hedging demand returning, which often improves forward return potential once price stabilizes.
Equity vs Bond Volatility
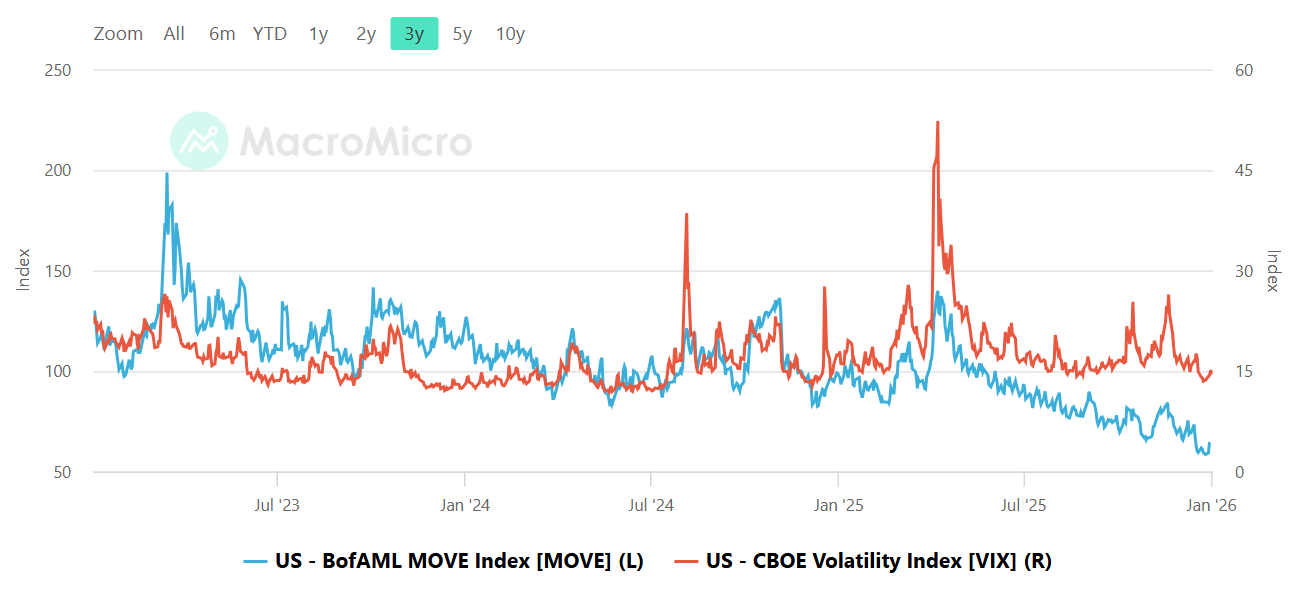
The Merrill Lynch Option Volatility Estimate [MOVE] Index from BofAML and the CBOE Volatility Index [VIX] respectively represent market volatility of U.S. Treasury futures and the S&P 500 index. They typically move in tandem but when they diverge, an opportunity can emerge from one having to “catch-up” to the other.
The MOVE index (blue) has been trending lower over the displayed window and sits near the lower end of its multi-year range at the right edge of the chart, while VIX (red) is also contained and not showing a persistent breakout. The important takeaway is that both vol regimes look more subdued than stressed. When bond vol and equity vol are both quiet, the market generally tolerates higher positioning and tighter risk budgets, which fits with the elevated manager exposure seen elsewhere. The problem is that this is a “good until it isn’t” setup: low vol can persist, but it also means the market is less conditioned for surprise. The practical read is that you are not currently getting a volatility-derived warning flare, but you also are not being paid to aggressively chase risk based on vol alone. Tripwires: a MOVE reversal higher that becomes disorderly (especially a spike above roughly 120) while VIX stays sleepy is often an early tell of equity stress that arrives with a lag. If VIX itself pushes up into the high teens and holds there, the market is shifting into a different day-to-day trading environment where positioning matters less than liquidity and hedging flows.
CNN Fear & Greed Constituent Data Points & Composite Index
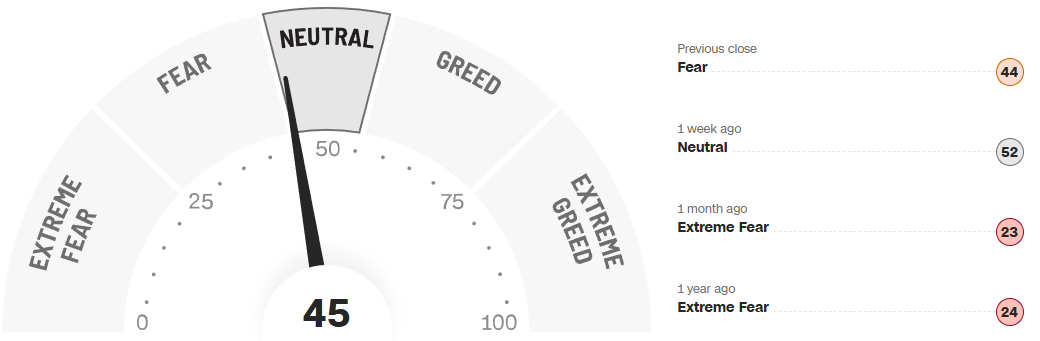
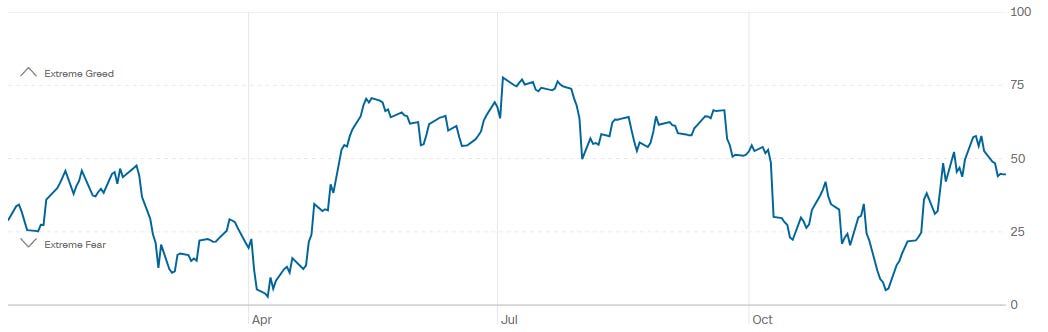
The composite Fear and Greed reading is 45 on the gauge with a prior close of 44. One week ago the reading shown is 52 (Neutral), so sentiment has cooled modestly versus last week. Zooming out, the same panel shows 23 one month ago (Extreme Fear) and 24 one year ago (Extreme Fear), which puts the current 45 in context: this is not a euphoric tape, and it is not a capitulation tape either. The one-year line chart reinforces that framing, showing sentiment capable of sliding into low readings and then recovering back toward mid-range levels. In practice, a mid-40s reading is a workable environment for selective risk-taking, but it does not carry the same “spring-loaded” upside you often get when the gauge is buried in the 20s. Tripwires are clean: a push into the 60s and 70s would indicate increasing optimism and a higher chance of exhaustion near highs, while a drop back below roughly 25 would move the market back into a zone where downside is often nearer-term self-limiting and better entries tend to appear after stabilization.
Social Media Favs
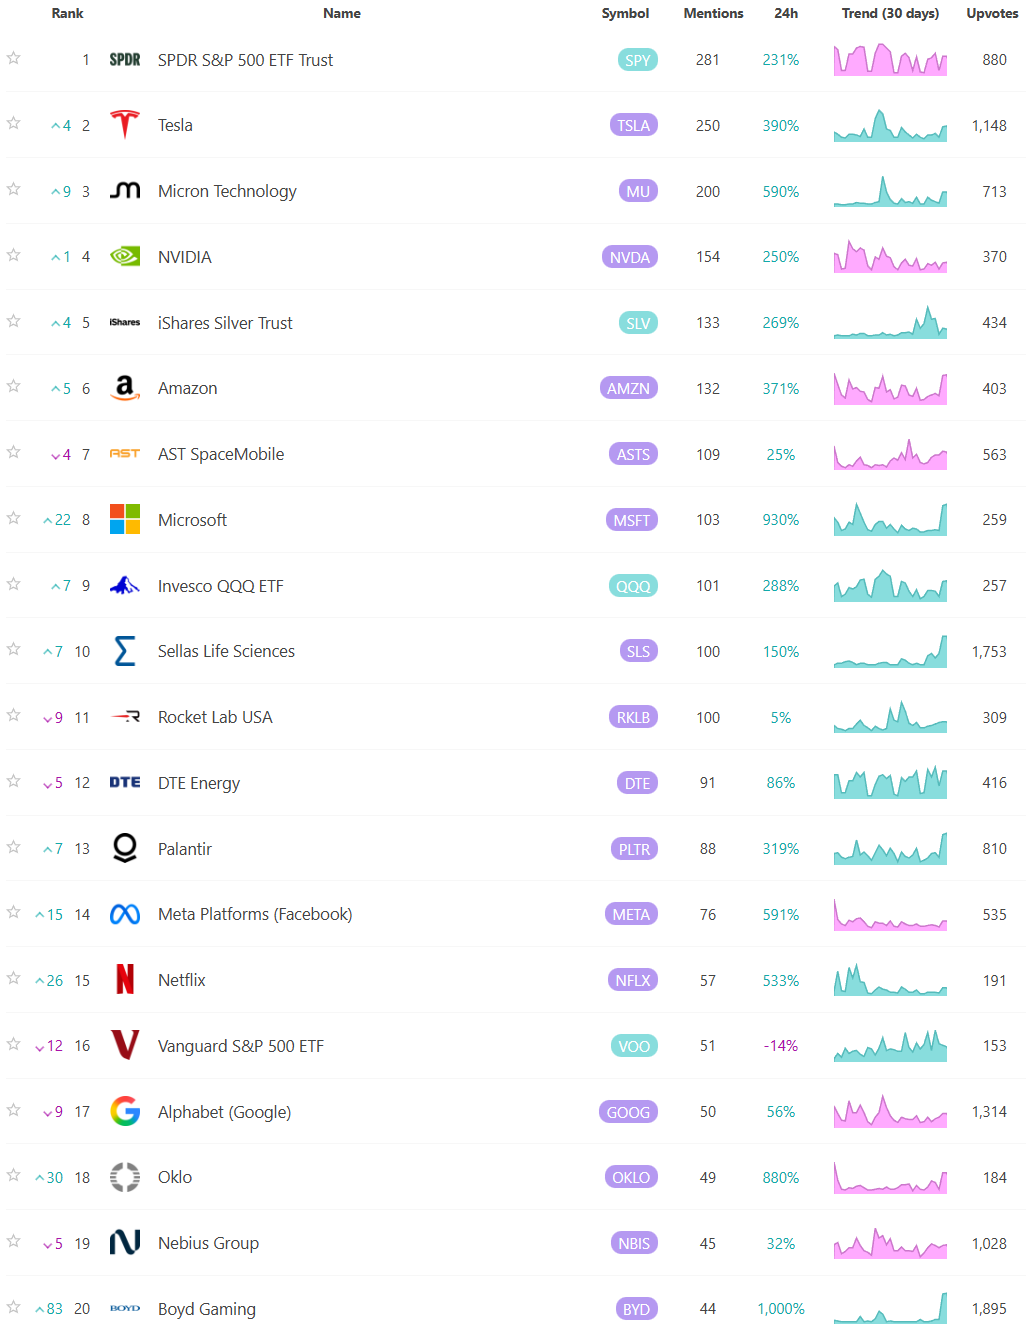
Social sentiment offers a real-time view of investor mood, often revealing market shifts before traditional indicators. It can signal momentum changes, spot emerging trends, and gauge retail investor impact—especially in high-volatility names. Tracking sentiment around events or earnings provides actionable insights, and when layered with quantitative models, can enhance predictive accuracy and risk management. Sustained sentiment trends often mirror broader market cycles, making this data a valuable tool for both short-term trades and long-term positioning.

Technician’s Playbook: Trading the Majors (SPY/QQQ/IWM/DIA)
When you’re a large institutional player, your primary goal is to find liquidity - places to do a ton of business with the least amount of slippage possible. VolumeLeaders.com automatically identifies and visually plots the exact spots where institutions are doing business and where they are likely to return for more. It’s one of the primary reasons “support” and “resistance” concepts work and truly one of the reasons “price has memory”.
The tape this week reads as controlled repair rather than fresh impulse, with each index tracing a familiar sequence of liquidation, response, and then balance around well-defined volume shelves. What matters most is not the day-to-day noise but where size showed its hand and whether price respected it.
SPY
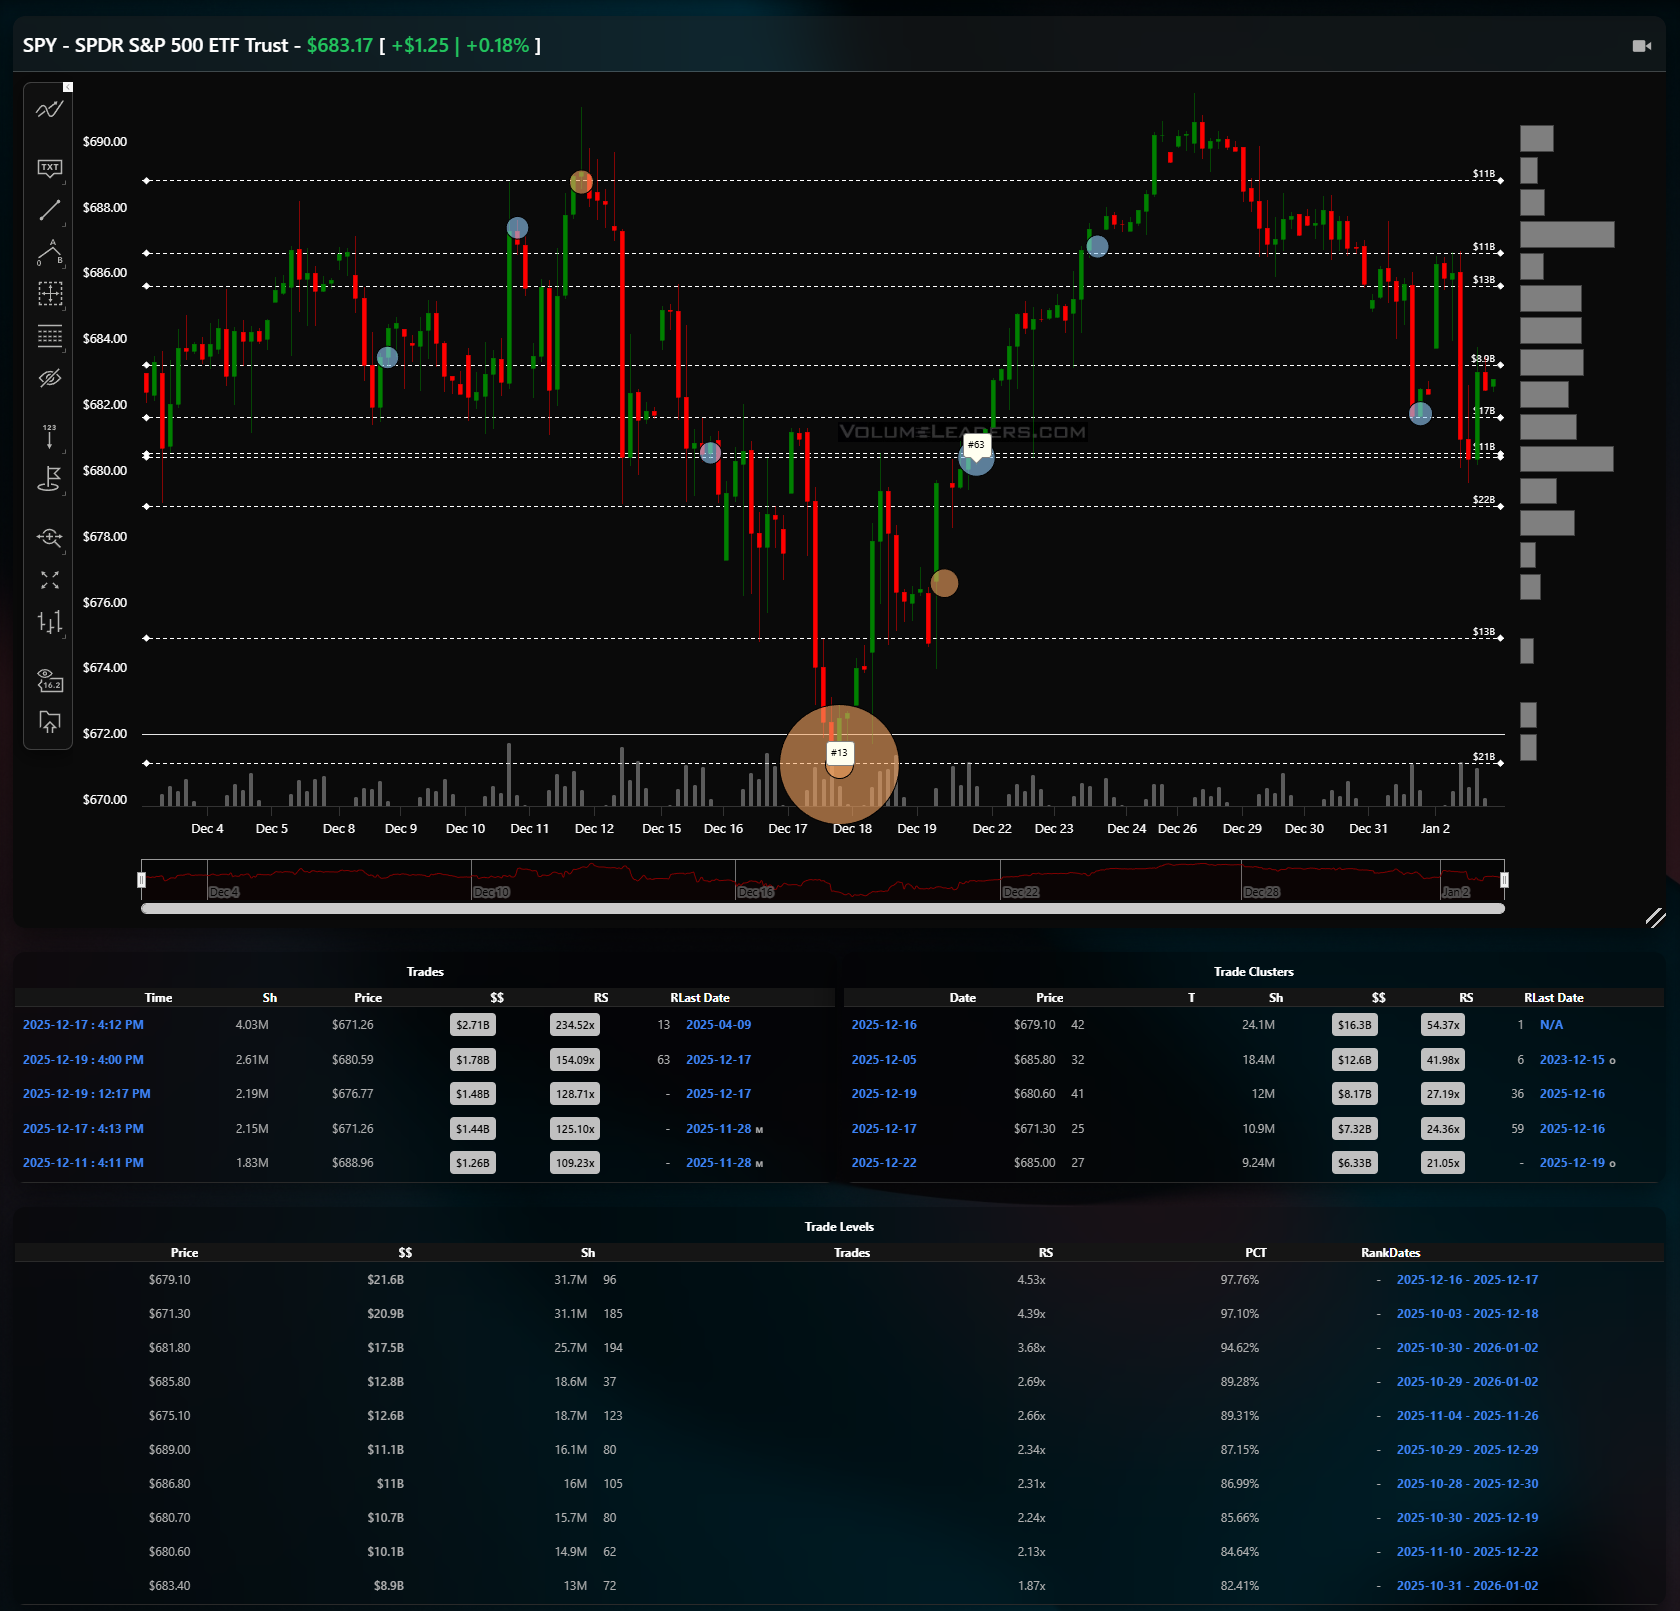
SPY spent the period carving a range with a clear downside flush mid-window and a methodical recovery back into prior value. The most consequential tell is the heavy print tagged as a #13-ranked historical trade near 671 to 672, marked around the December 17 low. That trade sits directly on the lowest high-notional level in the table, roughly 671.30 to 671.10, both carrying over $20B in notional with RS north of 4x and PCT near the top decile. The reaction off that area was immediate and directional, which is classic absorption rather than capitulation. Above there, SPY worked back into the 679 to 680 zone, where the largest level on the sheet sits near 679.10 with roughly $21.6B and the highest RS on the page. That band is the line of scrimmage. Acceptance above 680, which Friday’s action is now suggesting, opens the door to the upper shelf around 686 to 689, where multiple levels cluster with $12B to $18B and RS in the mid-2x to 3x range. Failure back below 680 shifts focus right back to 671, with little meaningful support in between. A disciplined read is simple: above 680, trade continuation toward the high 680s; below 679, trade defense and expect rotation back to the lows of the range.
QQQ
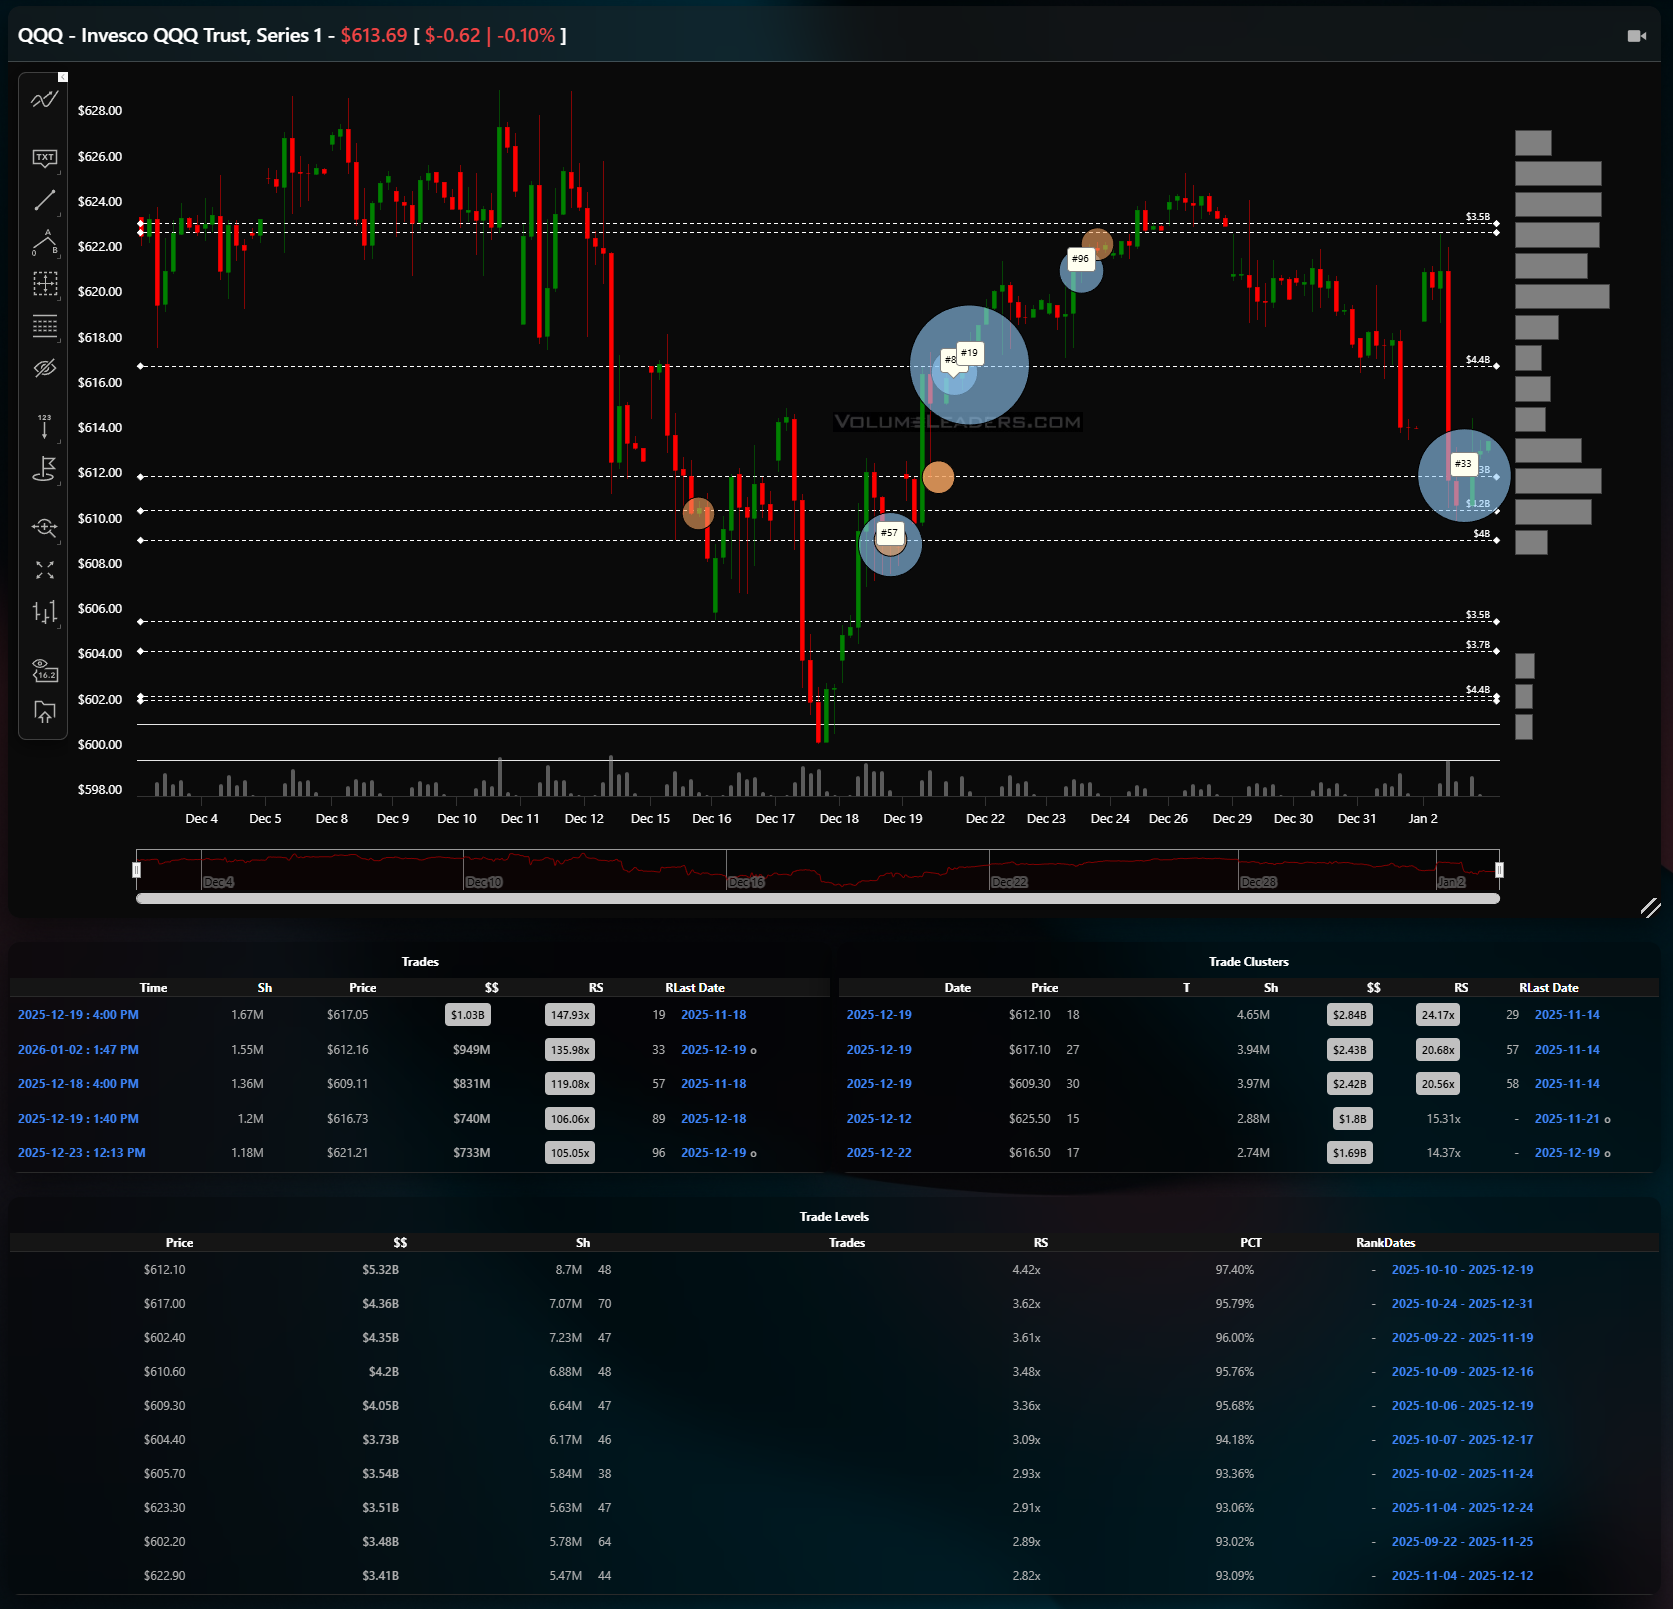
QQQ shows the same rhythm but with more fragile follow-through. The defining feature is the concentration of size between roughly 609 and 612. Multiple large prints sit there, including a visually dominant cluster and a top-100 tag around 612.10. The level table reinforces that importance: 612.10 carries more than $5B in notional with RS above 4x and PCT in the high 90s, making it the clearest pivot. The recovery leg stalled just under the low 620s, while the most recent pullback held above that 612 shelf. That is constructive, but only conditionally so. Acceptance above 622 to 624, where upper levels thin out, would confirm a new leg higher. Losing 612 on a closing basis would negate the repair and point price back toward the psychological 600 handle, where the next meaningful shelves appear. Tactically, QQQ is a trade-the-pivot tape: buyers can lean on 612 with tight invalidation, sellers gain edge on rejection in the low 620s.
IWM
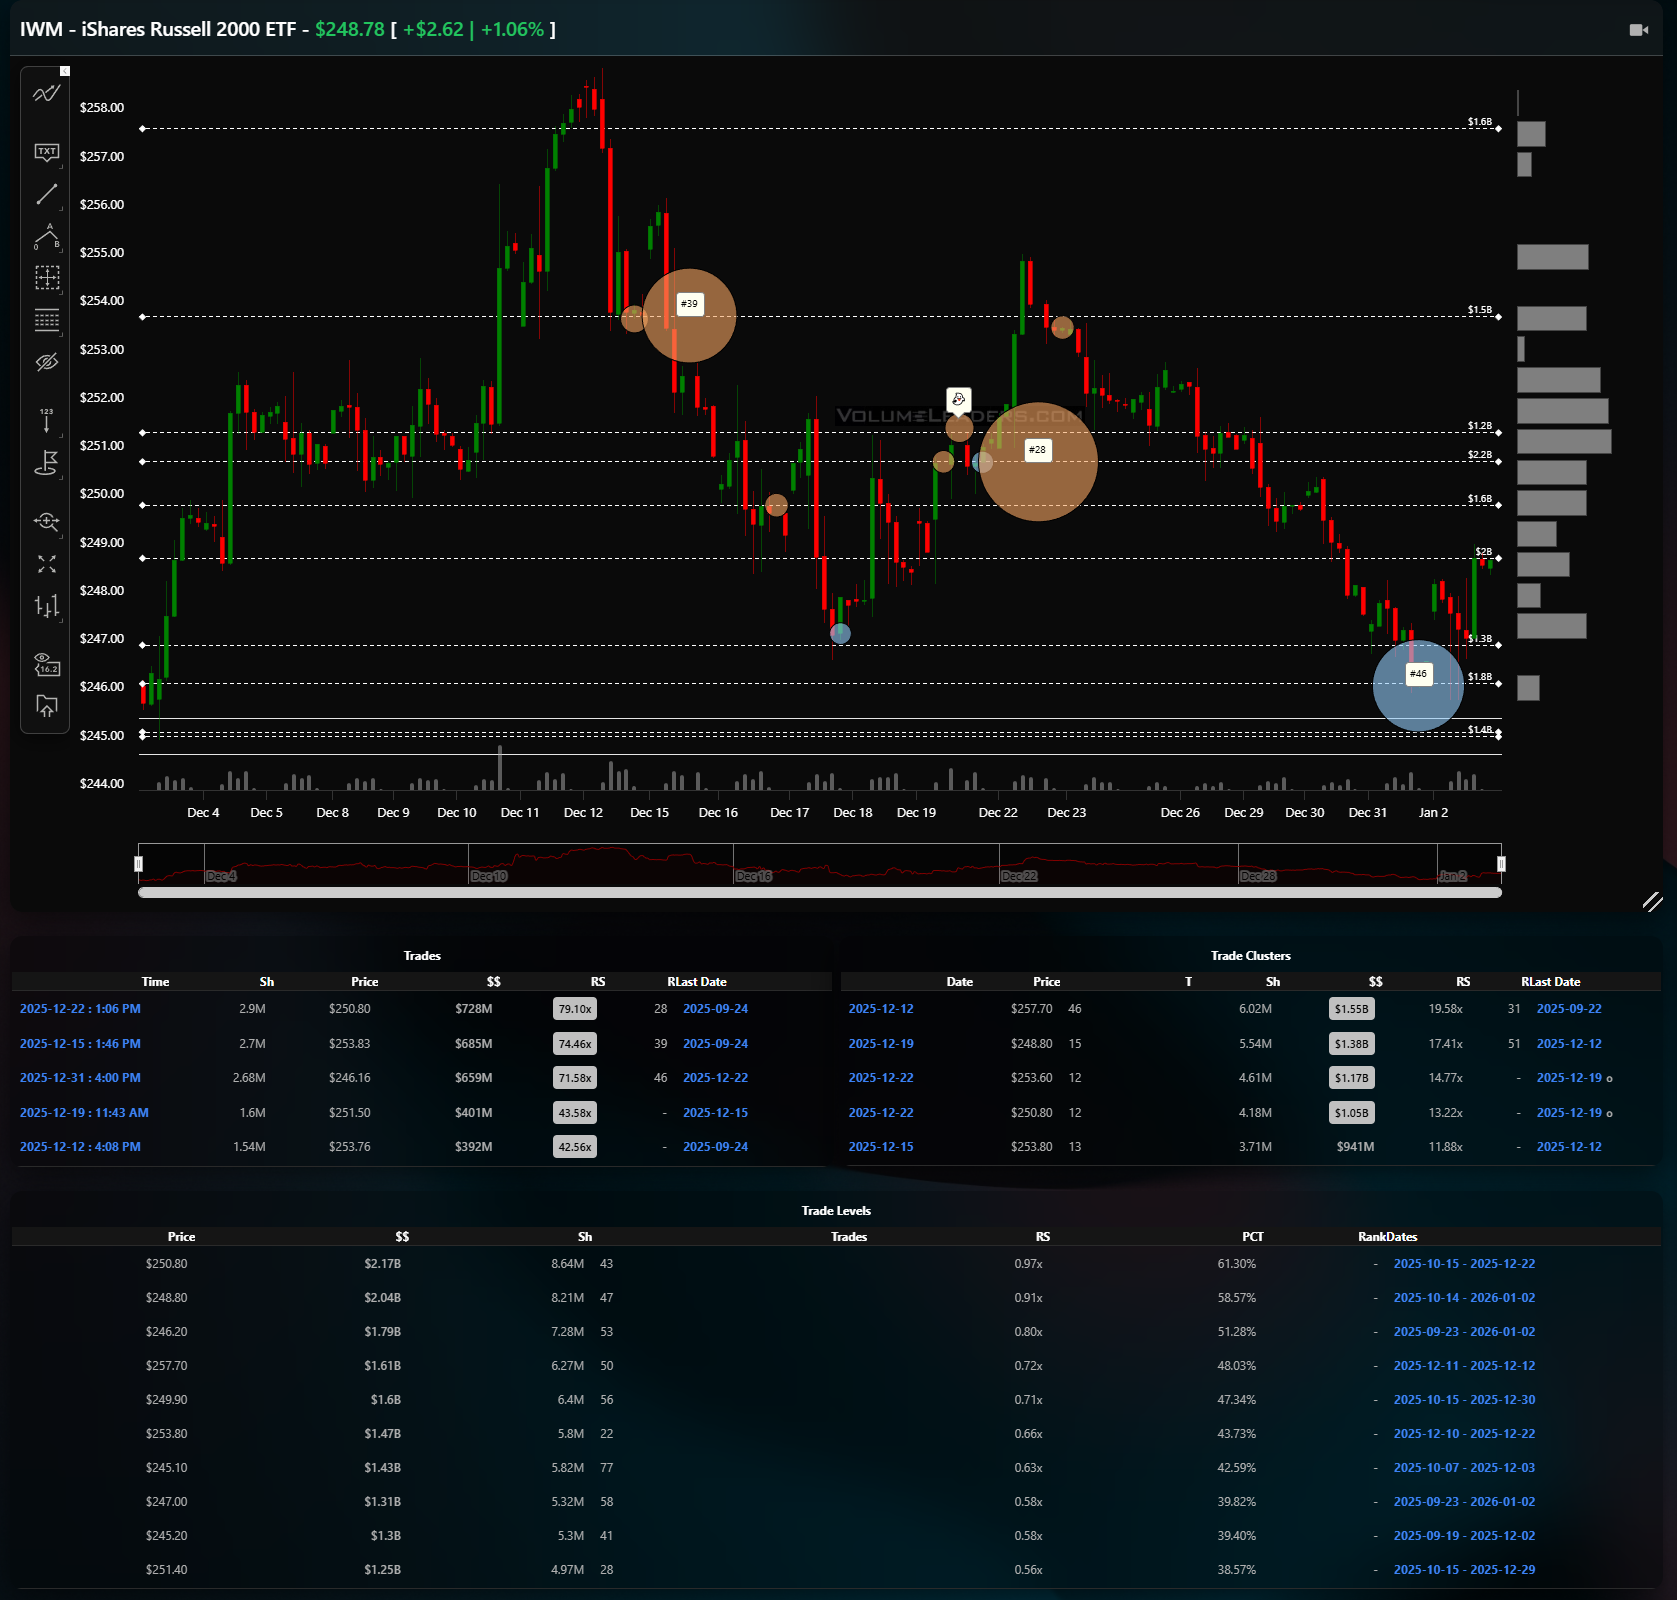
IWM remains the weakest structure, and the tape tells you why. The largest and most persistent size showed up on the way down, not on the rebound. A notable top-100 trade appears near 246, coinciding with the lowest volume shelf around 245.10 to 246.00, where notional exceeds $1.3B but RS sits well below 1x, signaling relative disinterest from long-term allocators. Above, the most meaningful resistance band is 250.80 to 251.40, with $2B-plus levels but RS still under 1x. That combination suggests overhead supply rather than committed sponsorship. Until IWM can accept above 251 to 252 and hold, rallies are suspect and best treated as rotational bounces. Below 246, there is little structural support until the mid-240s, making downside air pockets a real risk.
DIA
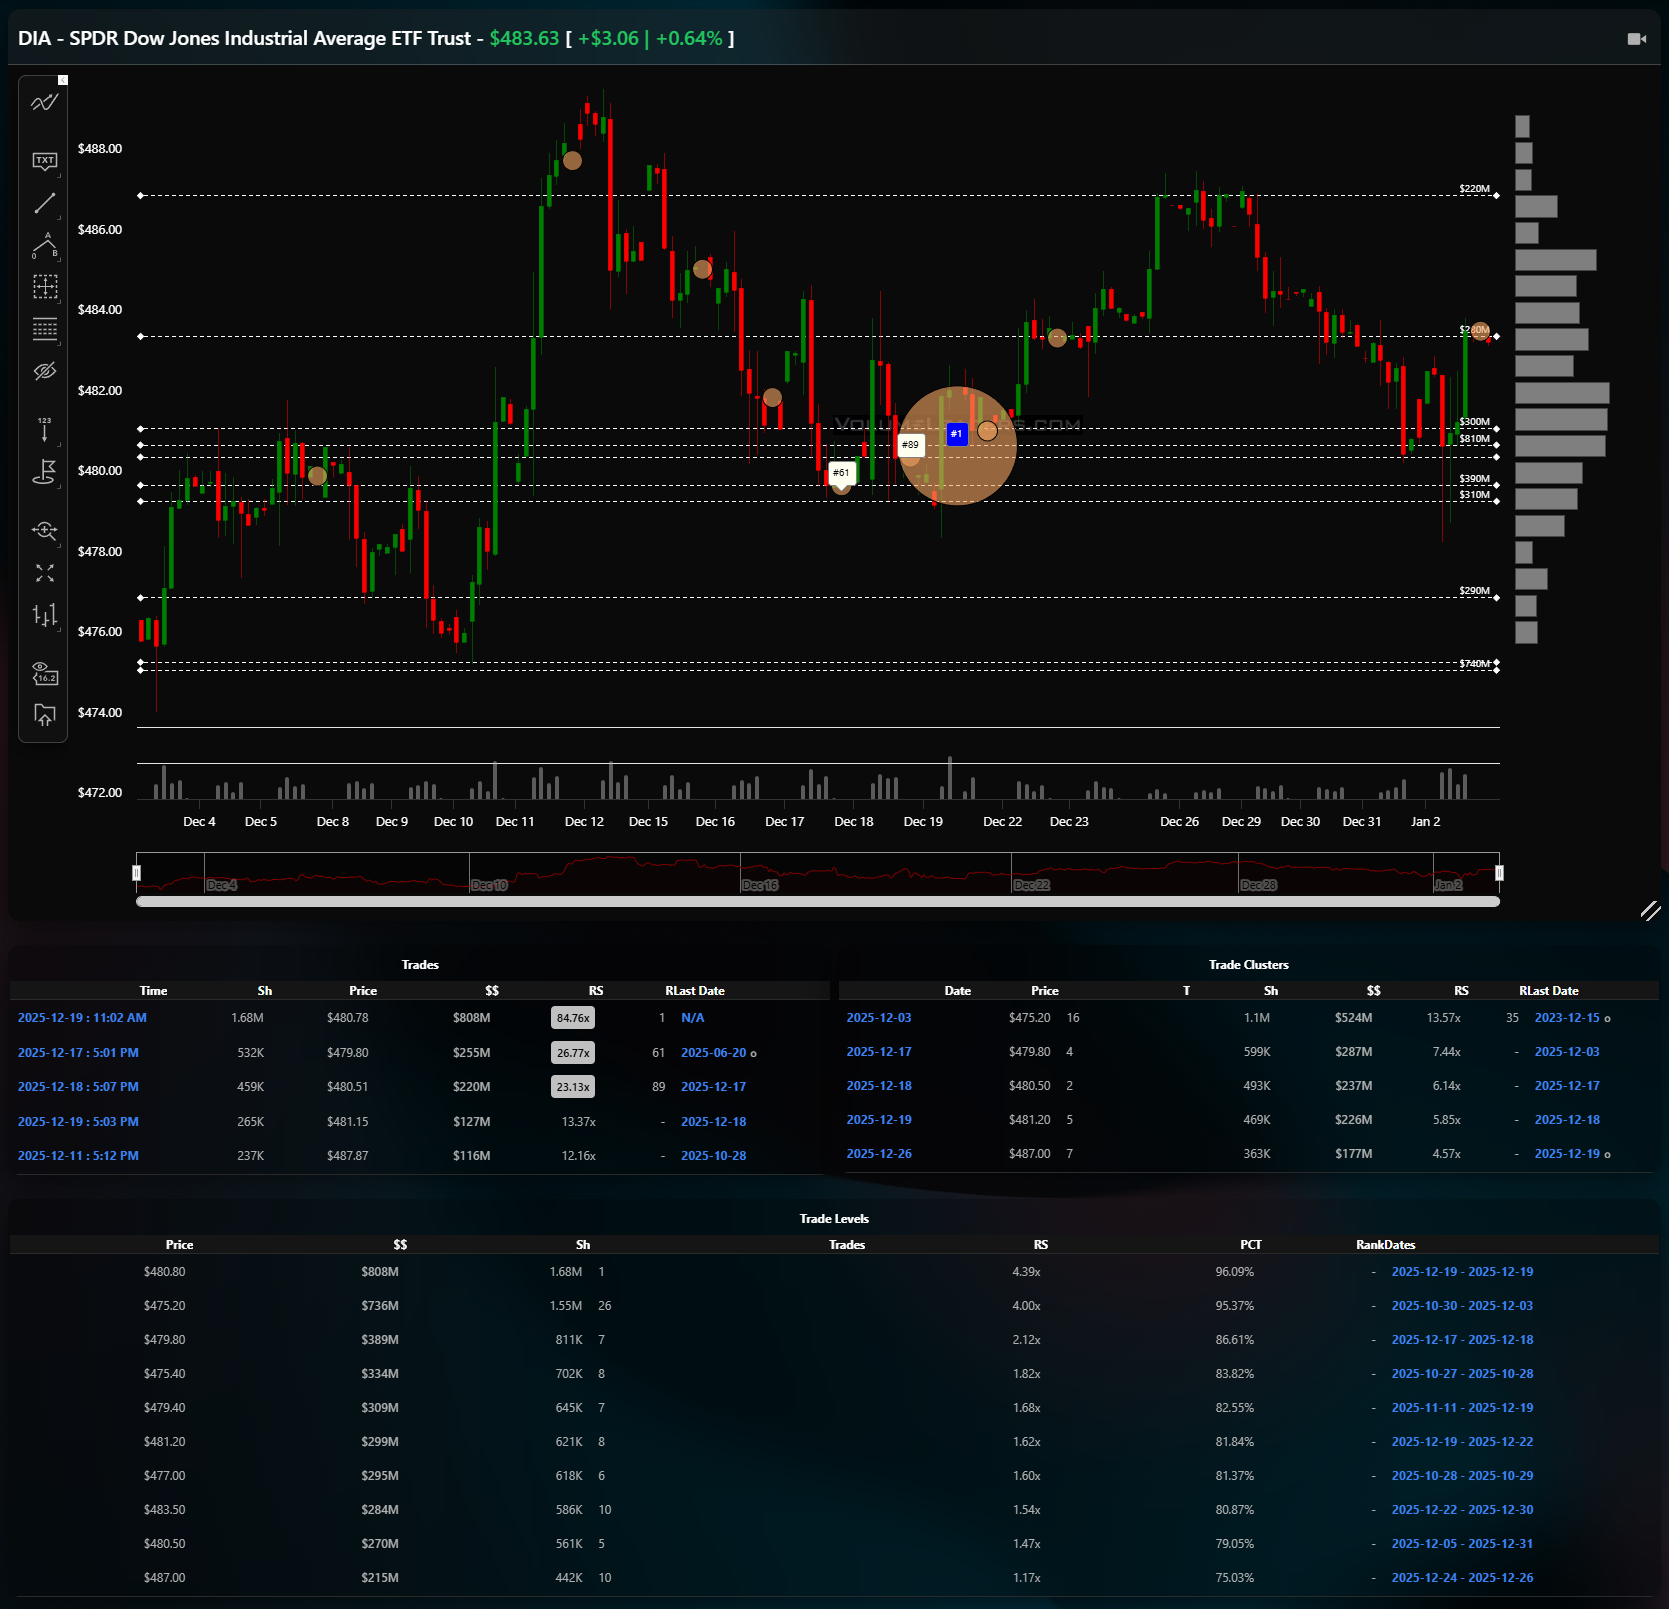
DIA reads as the steadiest of the group. After a sharp mid-period selloff, price found buyers around 479 to 480, where a large cluster sits with roughly $500M-plus and RS near 6x, a clear sign of responsive demand. The subsequent rebound carried DIA back into the 483 to 485 zone, now the immediate balance area. The largest level on the page sits near 480.80 with over $800M and RS above 4x, marking it as the primary line of scrimmage. Acceptance above 485 opens a path back to the 487 to 488 highs, where upside volume thins. Failure below 480 would flip the script and likely retest the lower shelf around 474 to 475.
Across all four, the common thread is that downside probes found size and were defended, but upside acceptance is selective and index-dependent. The bullish scenario is straightforward: SPY holds 579 and pushes through 586, QQQ accepts above 622, DIA holds 480 and grinds higher, and IWM finally reclaims 251. That would confirm continuation and invite momentum participation. The bearish path is equally clear: rejection at current balance, loss of SPY 579, QQQ 612, DIA 480, and IWM 246 would turn this from repair into redistribution, with the recent lows acting as magnets.
Bottom line: the tape is balanced but biased by where size defended, with SPY 579/586, QQQ 612/622, IWM 246/251, and DIA 480/485 as the prices that decide continuation versus failure.

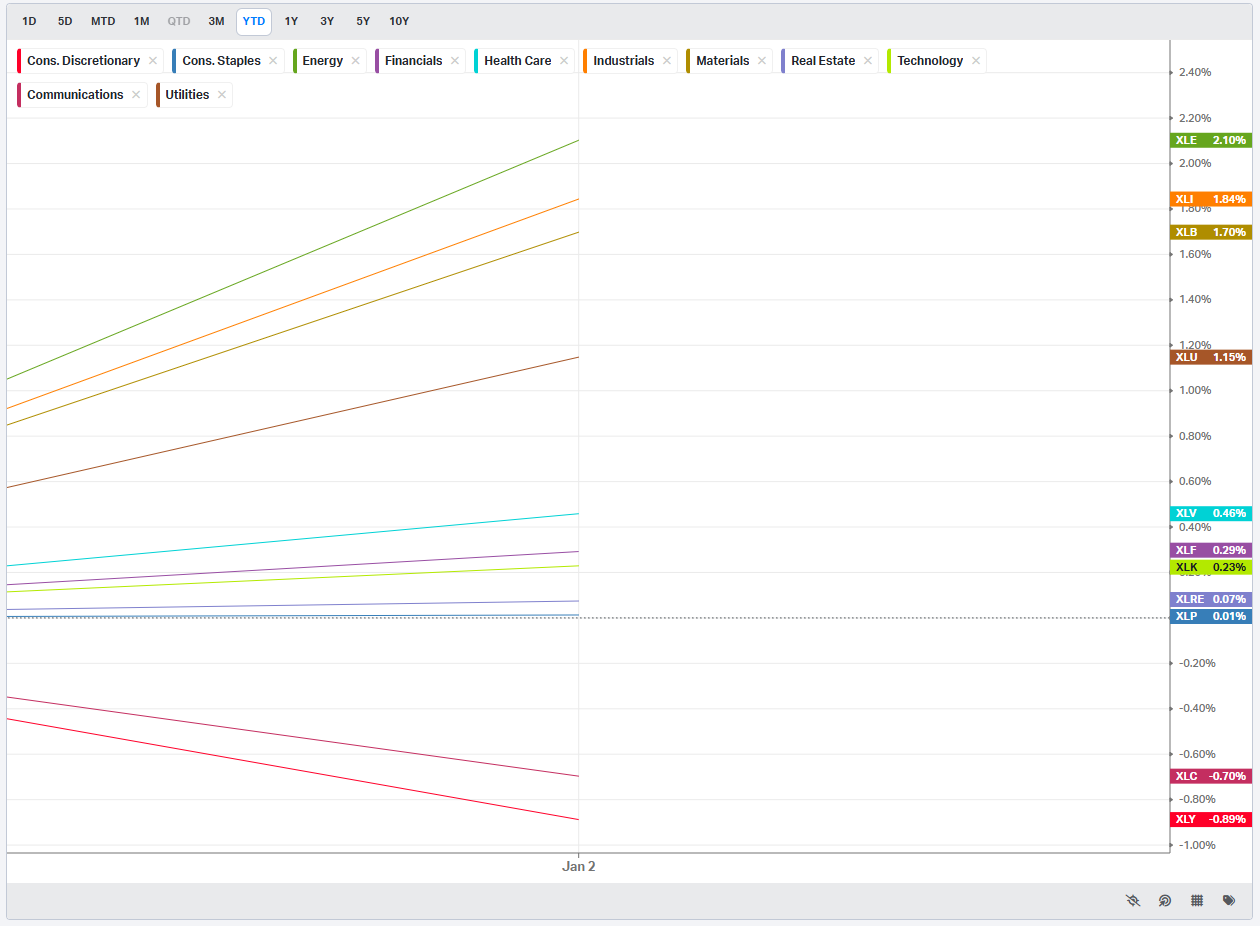
Summary Of Thematic Performance YTD
VolumeLeaders.com offers a robust set of pre-built thematic filters, allowing you to instantly explore specific market segments. These performance snapshots are provided purely for context and inspiration—think about zeroing in on the leaders and laggards within the strongest and weakest sectors, for example.
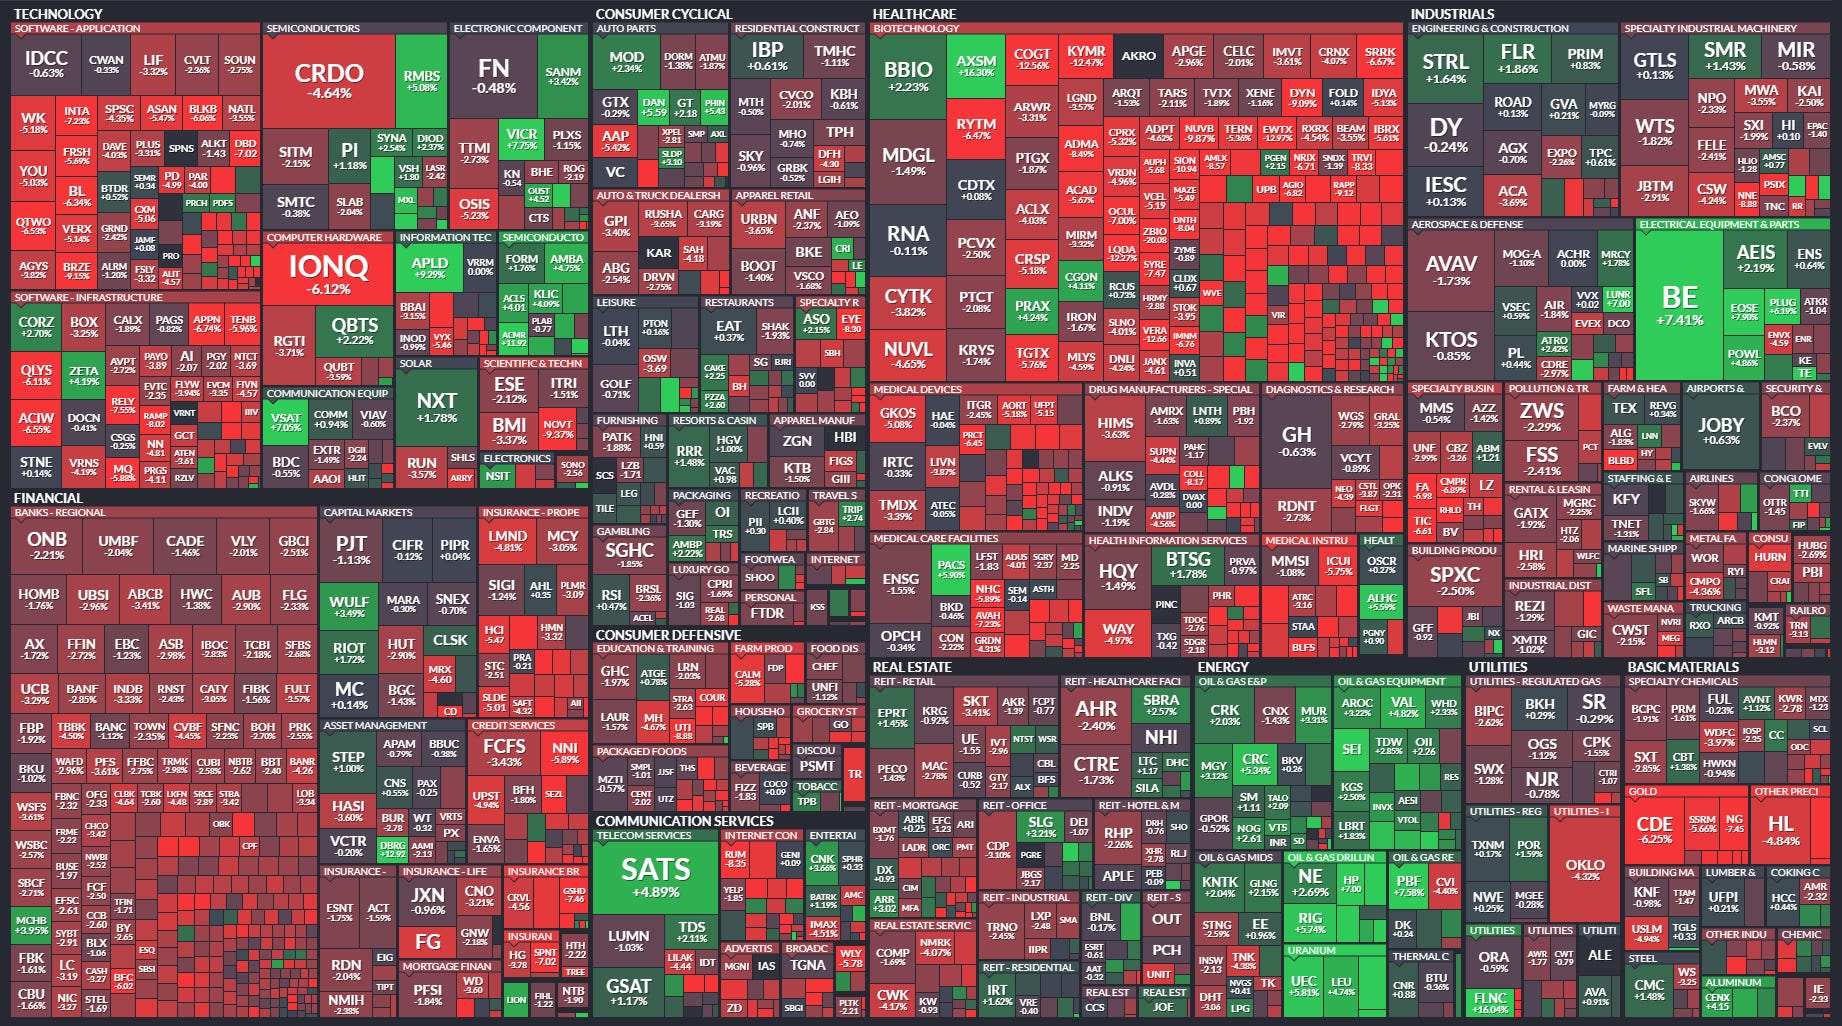
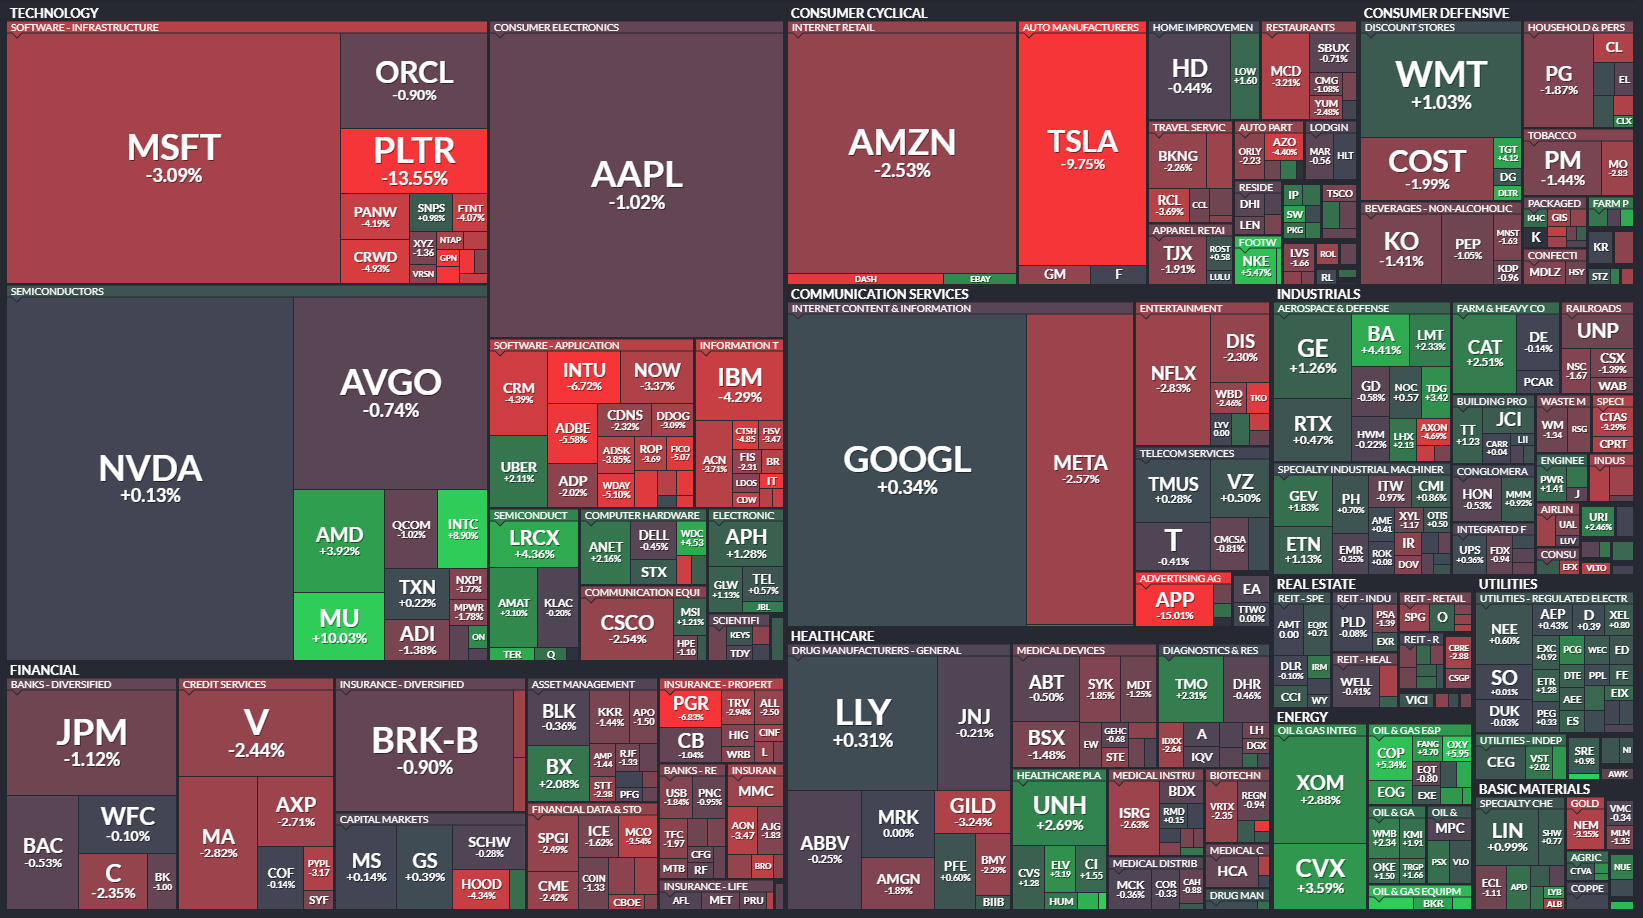
S&P By Sector
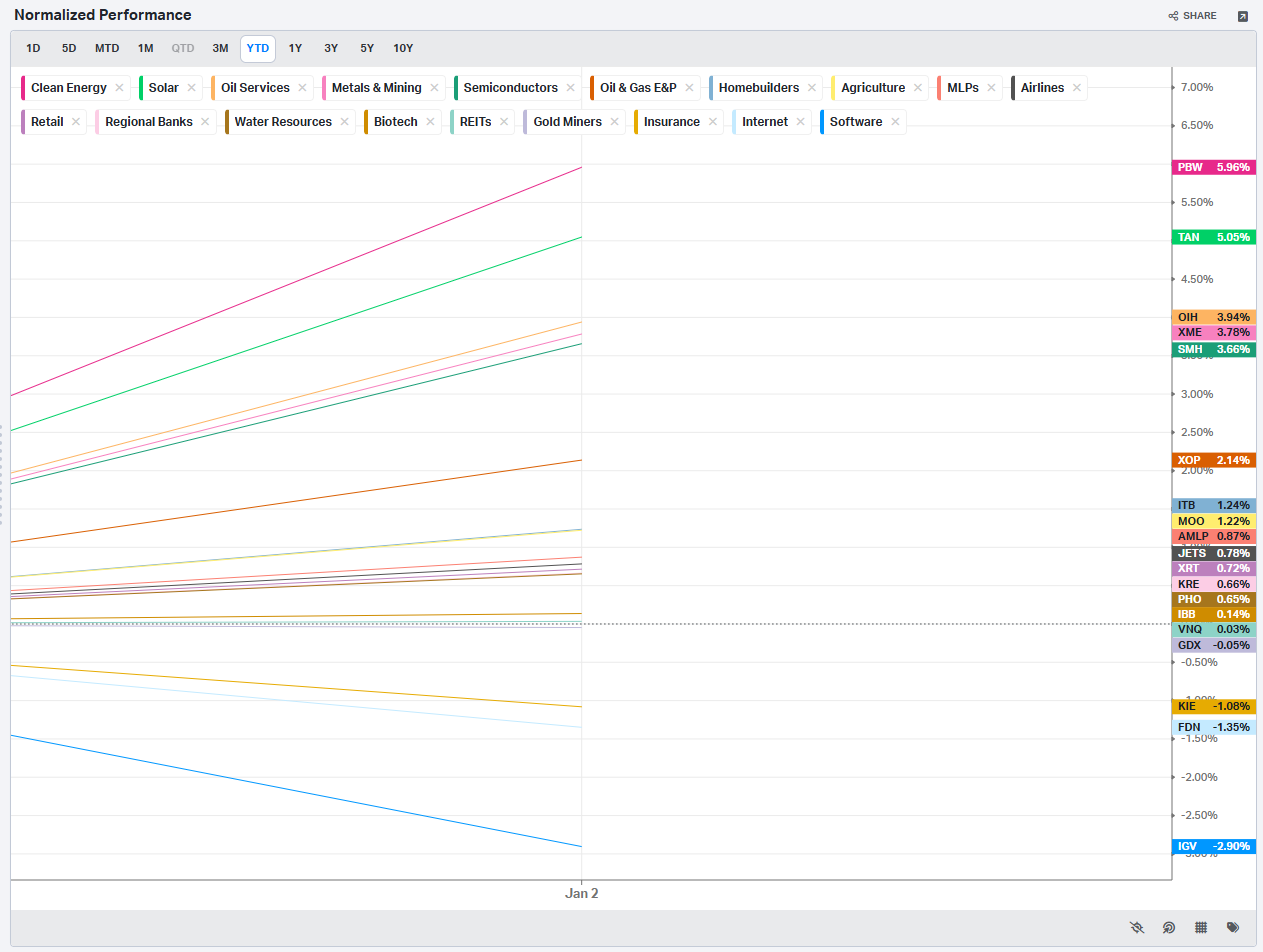
S&P By Industry
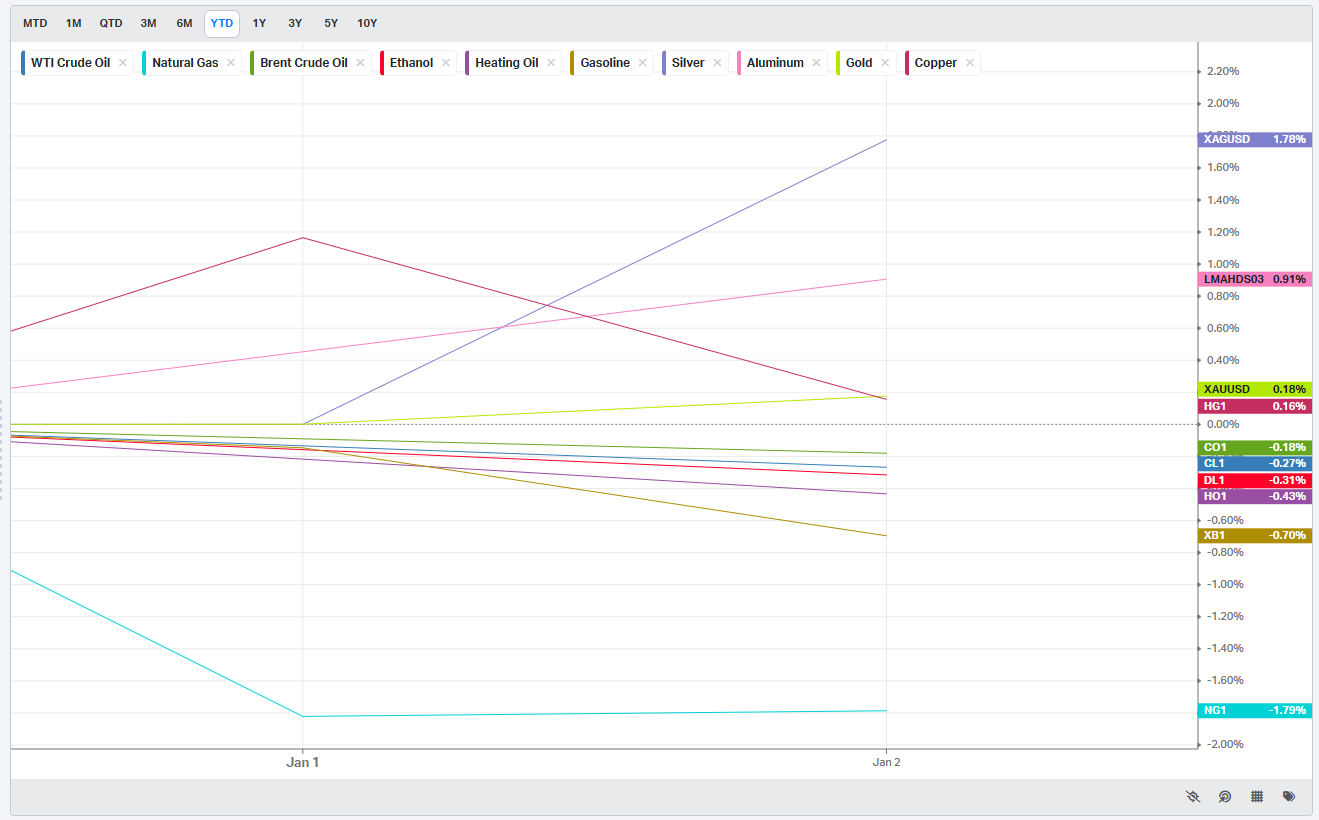
Commodities: Energy & Metals
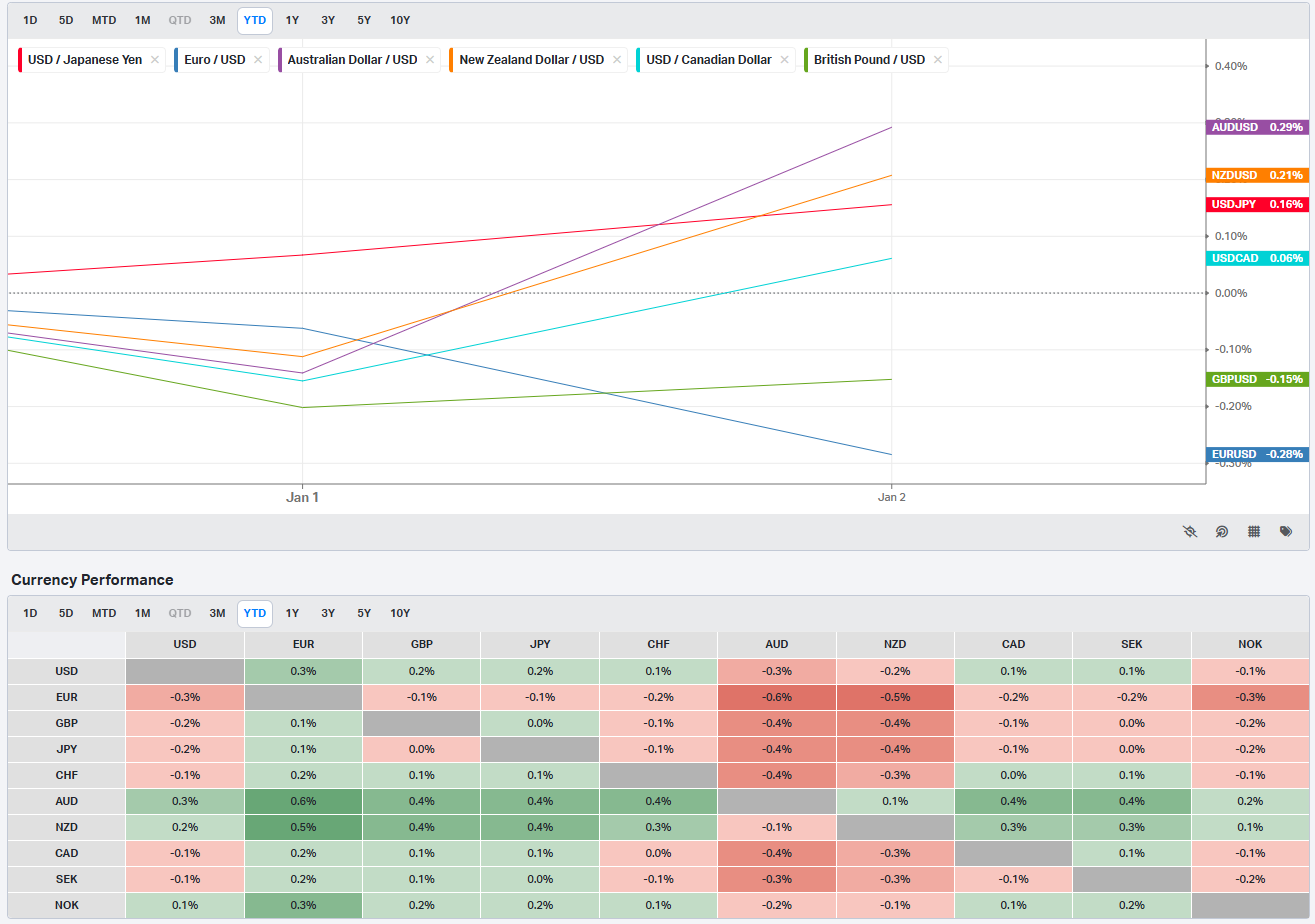
Currencies/Major FX Crosses
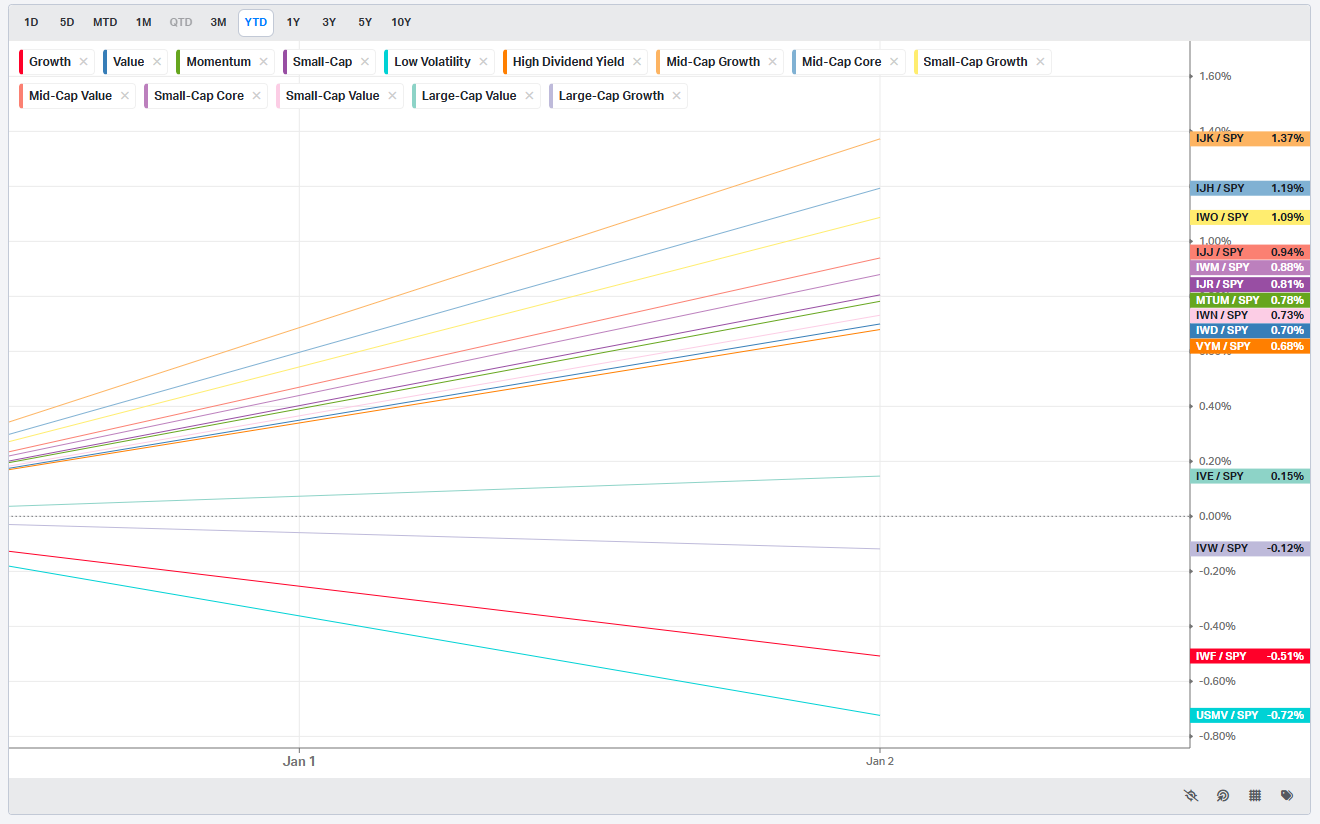
Factors: Style vs Size-vs-Value

Events On Deck This Week
Here are key events happening this week that have the potential to cause outsized moves in the market or heightened short-term volatility.
Data-Heavy Week, Narrow Earnings Tape
The coming week leans decisively macro-first. The calendar is dense with manufacturing, services, labor, housing, and trade data, while earnings are sparse and clustered midweek. That puts price discovery squarely in the hands of rates, the dollar, and expectations around growth versus inflation rather than bottom-up fundamentals. With positioning already elevated and sentiment no longer washed out, the market will be sensitive not just to beats or misses, but to sequencing: which data arrive first, and whether they reinforce or contradict one another.
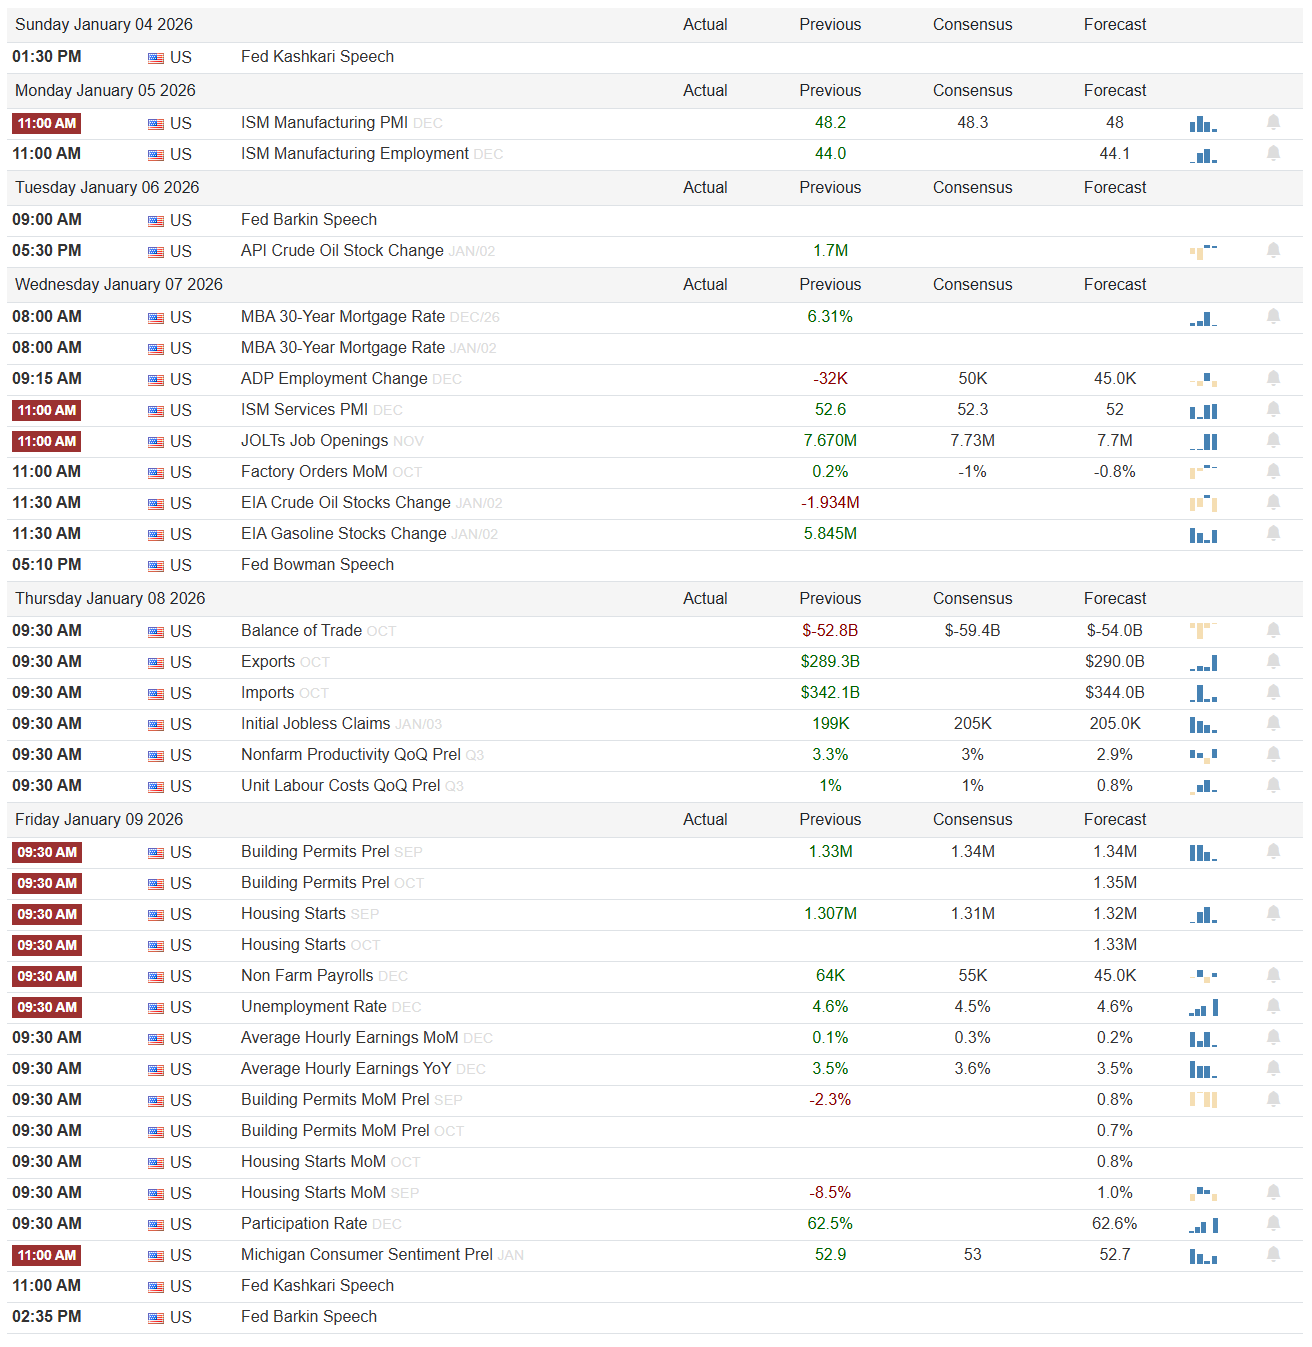
Monday opens quietly on the earnings front but not on the policy side. The highlight is ISM Manufacturing PMI at 11:00 AM. The prior reading is 48.2, consensus 48.3, forecast 48. Manufacturing remains in contraction territory, so direction matters more than magnitude. A print pushing back toward 50 would be interpreted as a growth-positive stabilization and likely risk-on, especially for cyclicals and small caps. A softer-than-expected number would reinforce slowdown narratives and favor defensives and duration. ISM Manufacturing Employment follows at the same time, with a prior of 44.0 and consensus 44.1. That sub-50 employment component has been a pressure point; further deterioration would weigh on labor confidence. Fed Kashkari speaks later in the day. Markets will listen for any pushback against easing financial conditions or hints that restrictive policy must persist longer than currently priced.
Tuesday brings another Fed speaker early, with Fed Barkin at 9:00 AM. Later, at 5:30 PM, API Crude Oil Stock Change shows a visible prior of 1.7M. Directionally, another build would lean disinflationary for energy, while a draw would reinforce recent tightness narratives. Energy-sensitive equities and inflation expectations will be keyed to confirmation or reversal here, especially with official EIA data coming the next day.
Wednesday is the heaviest day of the week. MBA 30-year mortgage rates are listed at 6.31% for the December 26 reading; the January 2 update is shown but the value is unreadable. Direction matters: a move lower would support housing sensitivity later in the week, while a rebound higher would pressure affordability. ADP Employment Change prints at 9:15 AM with a visible actual of -32K versus prior 50K and forecast 45.0K. That is a clear downside surprise if taken at face value, and while ADP is noisy, markets will react if it reinforces labor cooling. At 11:00 AM, ISM Services PMI comes in with a prior of 52.6, consensus 52.3, forecast 52. Services remains expansionary; a sustained move lower toward 50 would raise growth concerns, while resilience above 52 would be supportive for risk assets. JOLTS Job Openings follow, with a prior of 7.670M and consensus 7.73M. This is a key labor tightness gauge. A meaningful drop would reinforce cooling, while stability or upside would complicate the rate narrative. Factory Orders MoM show a prior of 0.2% versus a negative consensus, and EIA crude stocks print at 11:30 AM with a visible actual of -1.934M. That draw contrasts with the API build and will be watched closely. Fed Bowman speaks late, adding another policy filter to an already crowded session.
Thursday shifts toward trade and productivity. Balance of Trade shows a prior deficit of -$52.8B versus a larger consensus deficit. Exports and imports are both visible, with exports at $289.3B and imports at $342.1B previously. Narrowing deficits driven by export strength would be growth-positive, while contraction driven by weaker imports could be read as demand slowing. Initial Jobless Claims print at 199K versus a 205K consensus, still historically tight. Nonfarm Productivity QoQ is 3.3% prior versus a 3% consensus, and Unit Labor Costs are 1% prior with a 0.8% forecast. Strong productivity with contained labor costs is the cleanest risk-on mix, as it supports margins without stoking inflation.
Friday is labor and housing day. Building Permits and Housing Starts for September and October are listed, with September permits at 1.33M versus a 1.34M prior, and September starts at 1.307M versus 1.31M prior. MoM changes show a visible -2.3% for September permits and -8.5% for September starts. These are backward-looking but will shape the housing narrative alongside rates. The main event is Nonfarm Payrolls at 9:30 AM, with 64K actual versus 55K prior and 45.0K forecast. Unemployment Rate is 4.6% versus 4.5% prior, Average Hourly Earnings MoM is 0.1% versus 0.3% prior, and YoY is 3.5% versus 3.6%. This is a mixed but broadly cooling profile. A combination of modest job growth, stable unemployment, and softer wage inflation would be interpreted as Goldilocks. Michigan Consumer Sentiment closes the morning at 52.9 versus 53 prior, signaling cautious consumers but not capitulation. Fed Kashkari and Fed Barkin both speak again later, giving policymakers the last word of the week.
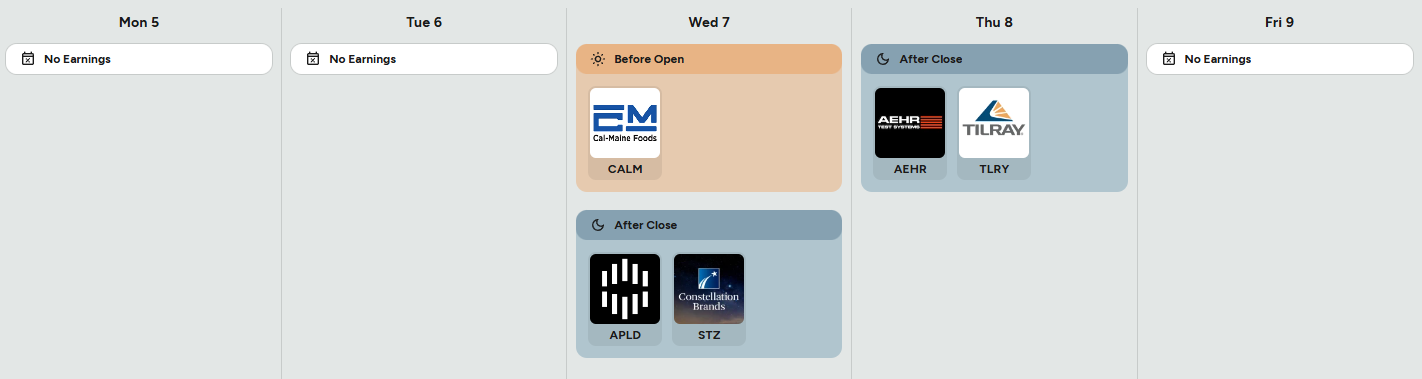
On the earnings and IPO board, activity is limited and concentrated midweek. Cal-Maine Foods reports before the open on Wednesday, offering a read-through on food inflation and consumer staples margins. After the close Wednesday, APLD and STZ report, with Constellation Brands particularly relevant for consumer demand and pricing power. Thursday after the close brings AEHR and Tilray. AEHR can spill into semicap equipment sentiment, while Tilray is a temperature check on speculative growth and discretionary risk appetite. With no earnings Monday, Tuesday, or Friday, these few prints may carry outsized influence within their niches.
Three sign-posts for active traders:
ISM Services holding above 52 while ADP and JOLTS weaken would favor equities over bonds.
A downside surprise in Nonfarm Payrolls with soft wages would likely push yields lower and support duration-sensitive assets.
Conflicting crude signals between API and EIA that resolve with a sustained draw would pressure inflation hedges and support risk.
Bottom line: this is a macro sequencing week where growth and labor data set the tone early, and Friday payrolls decide whether the market leans into a soft-landing narrative or pulls risk back.
Order Flow in Focus: Reading Smart Money Tells
Order Flow in Focus: Reading Smart Money Tells is a recurring segment that spotlights unique trading opportunities revealed through institutional order flow. Each feature dissects a moment when the tape quietly shifted—when large, ranked prints clustered at key liquidity locations and informed players positioned ahead of the move. The goal isn’t hindsight; it’s pattern recognition—learning to spot the footprints of capital that knows before the crowd does.
Netflix (NFLX) — When Balance Breaks, Liquidity Pays
This week’s Netflix tape offered a textbook lesson in how institutional order flow telegraphs risk long before price makes it obvious. The opportunity wasn’t hidden in indicators or headlines. It was embedded in where price couldn’t go, despite repeated attempts — and in what happened once balance finally failed.
For most of the week, NFLX was locked in a tight, well-defined auction between roughly 93 and 94. This was not random congestion. It was organized balance. Volume repeatedly concentrated in this range, and the blue-dashed #1 level — the most heavily traded price in NFLX’s history — acted as the gravitational center of the auction. Price rotated around it, probed above it, dipped below it, but kept returning. That behavior matters. Markets don’t spend this much time somewhere unless large participants are active.
Several clues emerged during this balanced phase.
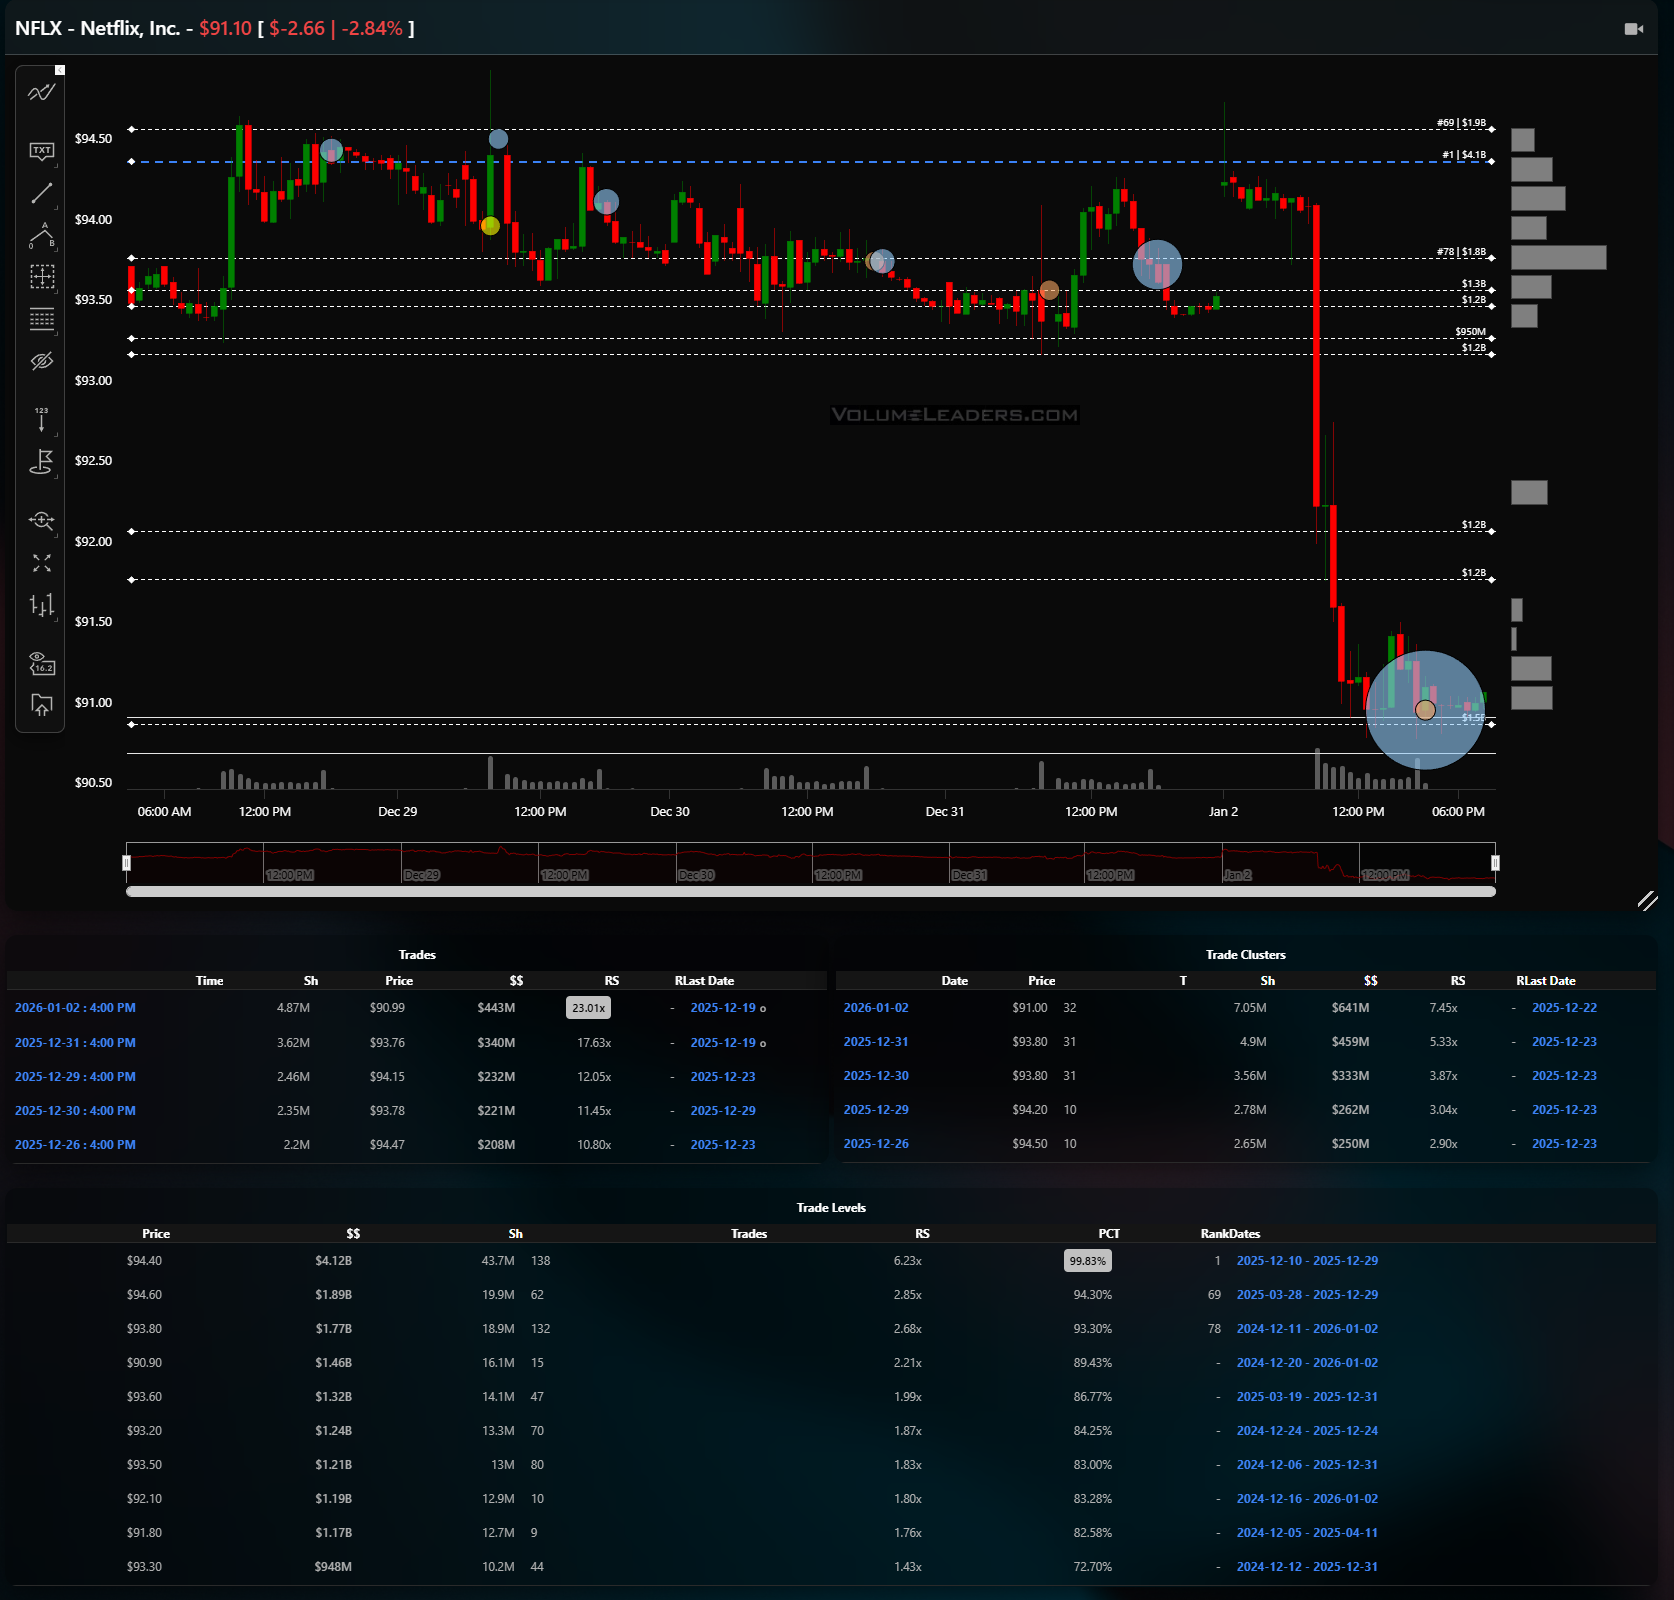
First, notice the repeated upside probes through 94. Each attempt pushed higher, printing prominent upper wicks, yet none of those excursions held. Each time price stretched above 94, supply appeared quickly and decisively, forcing the auction back down and back under the blue-dashed level. These weren’t sharp reversals driven by panic. They were controlled rejections — the kind you see when strong hands are absorbing liquidity rather than chasing price.
Second, the clustering of ranked prints near the highs was telling. Size showed up into strength, not on the pullbacks. That’s a critical distinction. If institutions were positioning for continuation, we would expect acceptance above 94 and expanding value higher. Instead, we saw repeated failure to build value above the most important historical volume node. The tape was quietly saying: upside is being sold, not sponsored.
From a trade construction standpoint, this created a very asymmetric setup. Balance plus failed range expansion is a warning, not a reason to trade aggressively. But once you recognize the character, you can prepare for what comes next. In balanced auctions, exits from balance tend to be violent — especially when the market has spent days advertising one direction and failing.
That moment arrived with the final gap-up.
The opening push higher looked, at first glance, like strength. Price jumped above the prior range, briefly escaped the balance zone, and attracted late buyers. But structurally, this move had all the hallmarks of exhaustion. There was no follow-through, no new value forming above resistance, and no sustained acceptance above the blue-dashed level. Instead, the gap served as a liquidity event — a final opportunity for larger players to distribute inventory to eager participants.
Once that gap failed, balance didn’t slowly unwind. It collapsed.
Price fell out of the auction and sliced cleanly through prior structure, accelerating toward the next meaningful liquidity pocket around 91. This was not a random destination. The chart clearly shows prior volume and resting interest in that zone, making it a natural magnet once the 93–94 balance gave way. When balance breaks, the market doesn’t negotiate — it moves until it finds the next area where two-sided trade can occur.
For traders reading the tape in real time, the play wasn’t predicting a crash. It was recognizing that upside had been repeatedly rejected, that acceptance above the most important traded level never materialized, and that the final push higher lacked sponsorship. From there, the trade becomes one of patience and discipline: wait for the imbalance to reveal itself, enter as balance fails, and exit as price reaches the next liquidity shelf rather than trying to capture every tick.
This is what smart money footprints look like. Not flashy. Not obvious. Just persistent behavior that, once understood, turns noisy price action into a clear narrative. Balance told the story. The wicks confirmed it. And liquidity did the rest.
Thank you for being part of our community and for dedicating your time to this edition. Your insights and engagement drive everything we do, and we’re honored to share this space with such committed, thoughtful readers. Here’s to a week filled with clear opportunities and strong performance 💰💰💰
— VolumeLeaders


